The following analyse report has been converted from MS WORD document to HTML format.
The analyse report as MS WORD dokument (1224 kB)
Analysis of an AIS Implementation in
Tokyo Bay
Richard Kjellberg
GP&C Sweden AB
Background
The Japanese Maritime Authorities (JMA) is currently studying the proposed standard for a Universal Shipborne Automatic Identification System (AIS) [R.1]. The JMA has declared that the system shall be able to handle a traffic situation in the Tokyo Bay [R.3] with up to 1.000 moving ships, at any time.
Assumptions
The analysis looks at the Tokyo Bay, extending from Tsurugi Saki to Tokyo [R.3]. The area is approximately 1370 km2. The analysis assumes that all ships are evenly distributed [R.2]. This is not the case in reality. To account for that, the number of ships, have been doubled, to 2.000. Each ship is reporting its position once every 6 seconds, giving a total of 20.000 reports per minute. Two AIS frequencies are used, which is in accordance with the proposed standard. Any VTS, shall have access to total coverage, of the whole region.
Results
Each AIS base station will have an effective VHF cell radius of approximately 12 km. Several VHF cells will overlap each other in order to ensure complete coverage and 100% throughput. A network connects the AIS base stations to the VTS centers. A total of 5 base stations will cover the region. The location of these, are Suno Saki, Tokyo Wan VTS Center, Honmoku, Chiba and Tokyo.
Each ship will receive position reports from 400 other ships, within a radius of at least 10 km, assuming that some space is reserved for base stations. Due to the overlapping VHF cells, the system will have communication redundancy.
Conclusions
The system is designed to allow overload. It is thus not possible to specify a maximum load. The reason for this is autonomous operation and strong discrimination of weaker signals. The VHF cell radius, of each station, will gracefully decrease, with an increase in traffic. In the scenario above, it will always be 10 km or more. When creating a ground infrastructure, the traffic density and geography are important factors to consider. The cell radius, of the base station, is not generally defined by the height of the antenna, but rather the traffic density. The communication redundancy enhances the visibility at the VTS and thus the safety of traffic management.
Based on scientific studies in [R.2] and the assumptions above, the proposed standard will be able to handle the traffic scenario in Tokyo Bay, both with respect to shipborne systems and ground infrastructure.
References
R.1 |
IALA, Technical Characteristics for a Universal Shipborne Automatic Identification System using Time Division Multiple Access in the Maritime Mobile Band, 1997, ITU-R M.[8C/XA], IALA |
R.2 |
Richard Kjellberg, Capacity and Throughput using a Self Organized Time Division Multiple Access Data Link an Surveillance Applications, Stockholm University and the Royal Institute of Technology, 1998 |
R.3 |
Tokyo Wan VTS, Radar Vessel Data Processing System, 1997, 3rd Regional Maritime Safety Headquarters |

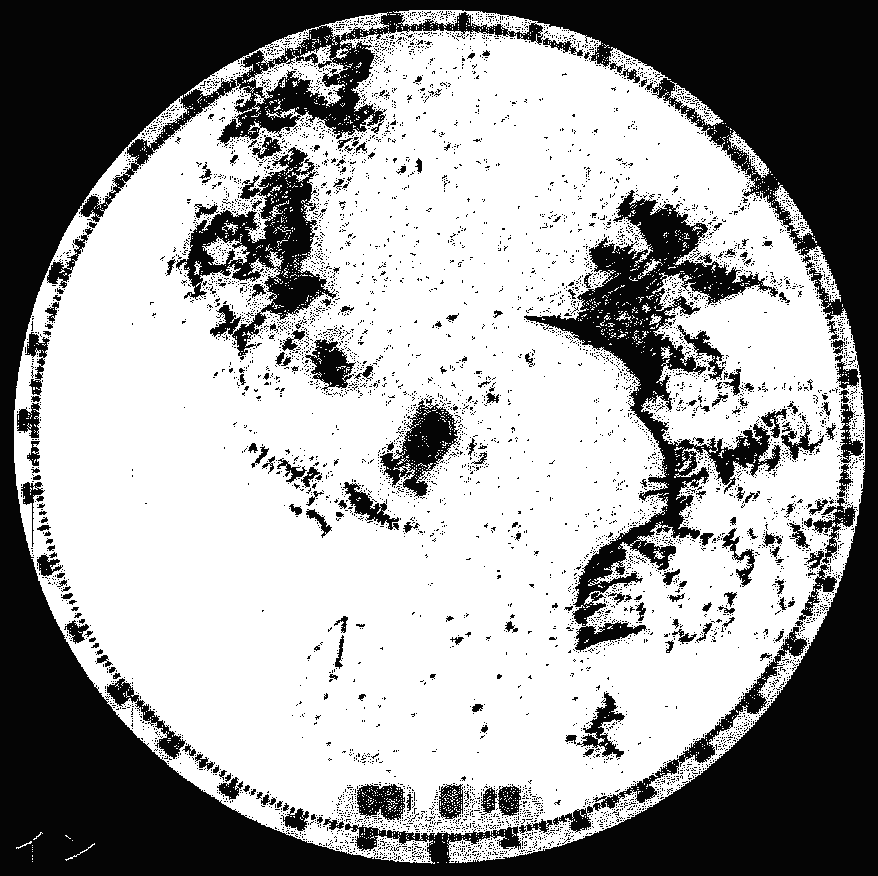
Radar image from the Tokyo Wan VTS
(courtesy Japan MA)
The picture, to the right, shows the Tokyo Bay and the location of AIS base stations. The base stations are located at (from bottom and up) Suno Saki, Toky Wan VTS, Honmoku, Chiba and Tokyo.
The coverage regions are illustrated by dotted circles with a radius of 12 km. The regions overlap, which ensures redundancy in the VTS network. This is desired since it increases the probability of high throughput and thus safety. It is assumed that the AIS base stations are connected in a network.
The coverage region is limited by traffic density, rather than line-of-sight. Thus, during periods of low traffic, the overlap will be a lot greater and further increase the redundancy.
The radar image, to the left, is a snapshot from the Tokyo Wan VTS. It shows fragments of the coastline on both the east, and west side of the Tokyo Bay. The radar is positioned at the VTS center.
The small dots, in the bay, are ships. The distribution, of traffic, in this region, is fairly even, but there are main fairways, which can be assumed to create concentrations of traffic.