The following analyse report has been converted from MS WORD document to HTML format.
STDMA analyse report as MS WORD dokument (2731 kB)
Capacity and Throughput
using a
Self Organized Time Division Multiple Access VHF Data Link
in
Surveillance Applications
Master Thesis
Rikard Kjellberg
Department of Computer and System Sciences
University of Stockholm
and
The Royal Institute of Technology
Stockholm, Sweden
GP&C Sweden AB
April 1998
Abstract
Aviation and maritime administrations are looking for alternative ways to replace or complement current radar systems for surveillance purposes. The use of Global Navigation Satellite Systems (GNSS) together with an efficient, digital, radio link, appears to be a feasible method. This thesis looks at systems which combines a digital radio, a computer and a GNSS receiver, together with an algorithm for organization of a digital radio link.
The described system, combines the line-of-sight characteristics of VHF frequencies, very accurate timing from the GNSS receiver (or some other timing) and a self-organizing transmission algorithm, to create an efficient data link. The data link can be shared among a large number of stations. The algorithm is called Self-Organized Time-Division Multiple Access - STDMA. The purpose of the algorithm is to allow short transmissions (called bursts), from several stations, to be organized in time, so that transmission conflicts are minimized. The algorithm is self-organizing, which means that controlling, or polling functions, via master control, are not needed.
The thesis studies an environment, with geographically distributed and moving stations (such as airplanes or ships), all equipped with STDMA stations. Each station operates in its own VHF cell limited by line-of-sight. The STDMA algorithm can only provide partial organization of the communication link since the VHF cells only partially overlap. Some of the communication will create conflicts, which may reduce the overall throughput. A model, describing the dynamics of this system, is derived. This model is used in order to analyze capacity and throughput.
The STDMA system works very well in this dynamic environment, ensuring safe delivery of safety critical information to surrounding stations. It also handles overload very well, with gracefully reduced VHF cell size as a result.
The features, which make the system feasible for surveillance applications, are:
time division multiple access (TDMA), which provides efficient use of the frequency resource,
the self-organizing algorithm, which makes it possible to handle overload, and a constantly changing population of participating stations, and,
strong discrimination of weaker signals, which promotes throughput and cellular operation.
Acknowledgments
The support, from the following individuals, has been a great asset during the research work:
Lars Zetterberg, Professor at the Royal Institute of Technology, for his engagement, critical analysis and expertise within the area of radio communication,
Lennart Dreier, Technical Director at GP&C Sweden AB, for questioning and challenging the results,
Håkan Lans, Inventor of the GP&C System, for his support and creative attitude,
Aud Vågsether, my fiancé, for her support and encouragement.
Preface
In the age of information it becomes important to efficiently communicate information. A wide variety of ways exist. One can use cable, fiber, satellites or why not regular mail? Information must generally travel over great distances. Satellites provide an efficient radio link for that. The radio medium becomes more and more important for digital communication. Take cellular mobile phones, for example. But, the radio medium is a very limited resource and therefore frequencies must be reused over and over around the globe. Depending on which frequency the communication uses, different characteristics apply to the way the information travels in the air. Some frequencies limit the information to travel by line-of-sight, thus enabling reuse quite often. Other frequencies allow it to travel around the globe. The application decides which characteristic is the most useful.
This thesis deals with digital radio communication in a line-of-sight environment. Information is communicated between geographically distributed stations, which generally also are moving at great speeds. Basic knowledge of frequency sharing using time division, multiple access, is an aid when reading the material.
Contents
1 Introduction *
1.1 Current Surveillance Systems
*1.2 Looking Ahead
*1.3 Contributions
*1.4 Contents
*
2 Purpose and Problem Definition *
2.1 Purpose
*2.2 Problem Definition
*2.3 Problem Domain
*
3 Method *
3.1 Scientific View
*3.2 Scientific Method
*3.3 Research Method
*3.4 Collection of Data
*3.5 Reliability and Validity
*3.6 Work Method
*
4 Basic Concepts *
4.1 Surveillance Systems
*4.2 Organization
*4.3 Modes of Operation
*4.4 Synchronization
*4.5 Capacity
*4.6 Time Frame and Time Slots
*4.7 Report Rate
*4.8 Net Throughput
*4.9 The STDMA Algorithm
*
5 Results *
5.1 Transmission Characteristics
*5.2 Propagation and Slot Boundaries
*5.3 Synchronization
*5.4 Organization
*
6 Conclusions *
6.1 Fulfillment of Purpose and Problem Definition
*6.2 Transmission Characteristics
*6.3 Propagation and Slot Boundaries
*6.4 Synchronization
*6.5 Organization
*
7 Discussion *
7.1 Autonomous Operation
*7.2 The Analysis Model
*7.3 Common Issues
*7.4 Abnormalities
*
8 Appendices *
8.1 A - The GP&C System
*8.2 B - Transmission Characteristics
*8.3 C - Propagation and Slot Boundaries
*8.4 D - Synchronization
*8.5 E - Organization
*
9 Acronyms *
10 Vocabulary *
11 References *
Aviation and maritime administrations are currently investigating new technologies for use in modern surveillance systems.
Traditionally radar (RAdio Detection And Range) has been the cornerstone in surveillance systems. Two types of radar exists: primary and secondary. Primary radar sends out a high-powered radio signal, which may bounce back, after hitting a target. The time, between transmission and receipt of the return signal, indicates the distance to the target. Secondary radar requires equipment to be installed onboard participating vessels. This equipment will send a digital signal back to the transmitter when it detects the radar signal (generally a secondary signal, from a transmitter piggybacked on the primary radar antenna). The digital signal can contain an identifier and altitude, for example. Radar gives very little and often inaccurate information. The update rate is generally slow, since it is equal to the rotation rate of the radar dome. Partly due to the shortcomings of radar, aircraft are required to fly with great spacing. This introduces traffic delays, which is quite costly for commercial airlines.
1.2 Looking Ahead
A surveillance system, based on other means than radar, can introduce new benefits. Assume that each vessel can continuously determine its own position. A position sensor, such as a GNSS receiver can do just that. This position is then broadcast, in an orderly fashion, on a globally shared digital radio link. In this context, a digital radio link is one, or more, frequency channels, shared among several users. The sharing may be done, by dividing time into time slots, each slot being an opportunity to access the channel and transmit data. This type of system is independent of ground infrastructure (i e radar stations) and will work equally well all over the globe. It is a new application of digital radio communication. The demands on such an application are yet to be fully explored. The number of participating stations is unknown and constantly changing. In addition, the stations are constantly moving. The digital radio link must be able to handle overload situations without collapsing. Safe communication is important, since it shall be used in surveillance applications.
All of these environmental requirements must be considered prior to implementing an operational system. There have been made some attempts to specify the requirements on such systems, from a user point of view [RTCA 186].
1.3 Contributions
This thesis explores the environmental requirements based on the current technological developments within the maritime and aviation fields. Terms, such as capacity and throughput, are defined and quantified with respect to the use of Self-Organized Time Division Multiple Access (STDMA) in the surveillance application.
The results can be an aid in the continued work of developing standards and legislation for broadcast surveillance systems.
1.4 Contents
The thesis is structured in a main section and appendices. The main section presents some basic concepts, results, conclusions and discussion. The rational behind the results and conclusions can generally be found in the appendices.
2 Purpose and Problem Definition
2.1 Purpose
The purpose of this thesis is to…
establish suitable definitions for the terms capacity and throughput,
examine the dynamics and features of a data link based on STDMA,
create descriptive models, which aid in quantifying capacity and throughput.
The problem definition is:
Taking into account the application environment, transmission characteristics and the ability to organize transmissions using STDMA, what capacity and throughput can be expected on the STDMA data link in surveillance applications?
This question requires a definition of the terms capacity and throughput.
2.3 Problem Domain
The problem domain deals with:
..the sharing of a digital VHF Data Link (VDL) for the purpose of surveillance applications.
When analyzing a VDL, a number of features can be taken into account.
Propagation of radio waves, packet protocol, modulation techniques, just to mention a few. It becomes necessary to narrow the problem domain. Emphasis is on the STDMA algorithm and the effects it has on capacity and throughput.
3 Method
The method is described, using terms and definitions from [Holme et al].
3.1 Scientific View
This work is based on practical experiences from the application environment (maritime and aviation) and anticipated future demands on surveillance systems.
Several different VDL systems compete to be the future core of surveillance systems. Due to this, it can be assumed that available documentation is only partly objective in its character. Commercial and national interests appear to play a large role and thus influence the written material. A humanistic view is applied, in order to deal with this.
A quantitative scientific method is used, though the results often have to be post-analyzed. Some source material must, however, be viewed using a qualitative scientific method.
3.3 Research Method
Case studies, desktop analysis and simulations are used in the research work. A case study is merely a way to test derived equations and models in a scenario modeled after real life. The desktop analysis is based on radio communication theory and experiences from tests on existing equipment. Simulations are performed in order to study a specific behavior or feature. The simulations are thus not performed on a complete system model. All simulations are done using the C/C++ programming language.
Since this field is little explored, primary data is predominately used. Primary data is derived by analysis and simulation. Secondary data is used in those cases when it can be verified to be applicable to the problem under study.
Primary data dominates, and it is thus possible to state that the source is known. Personal experience from the application environment, as well as the technical environment should aid in establishing reliability. But, due to the fact that I am working at a company involved in STDMA technology, it is important, that all results are scrutinized, by others too. Results are therefore verified with two persons, both experts in radio communication. These persons are independent in the context that they have no relation to each other. Mr Lars Zetterberg is a professor at the department of signals, sensors and systems, at the Royal Institute of Technology. Mr Lennart Dreier is technical director at GP&C Sweden AB, a company working with STDMA technology (and the company asking for this analysis).
Validity is determined when the results are checked to fulfill purpose and problem definition.
3.6 Work Method
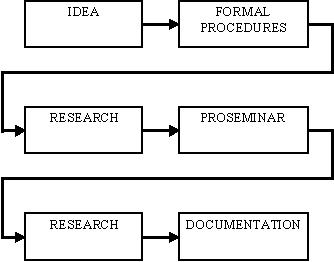
The work method is described in figure 3.6.a below:

Figure 3.6.a
3.6.1 Idea
The Swedish Civil Aviation Authorities (SCAA) has conducted tests, on a limited scale, as a proof of concept for the STDMA system. The SCAA has also performed simulations on a European traffic scenario [Frisk et al] [PMEI].
It was discovered, however, that no one had made an analysis, simulation or test, which modeled the STDMA system in high density, traffic situations. Since the system is a candidate for future surveillance applications, this scenario is the foundation for the analysis work. The idea is to describe the behavior of the STDMA system in the surveillance application. The primary work was to be done as a desktop analysis, supported by simulations of isolated features, requiring more thorough investigation.
3.6.2 Formal Procedures
The idea is transferred into a purpose and problem definition. The problem domain is defined and narrowed. These initial results are then communicated to the university, for approval.
3.6.3 Research
The research started with a literature study. Books and articles about communication theory were studied, in order to find commonalties with the STDMA system. Documentation on surveillance systems, in general, was examined, for example [S. R. Jones]. STDMA related documentation, such as analyses, simulation reports and descriptive texts, were also part of the literature study. With own personal experiences and new basic knowledge about the problem domain, the analysis was divided into areas of interest. Each area was then examined separately and presented in an appendix. A desktop analysis was conducted. Output from the analysis was verified by simulation in C/C++ unless, the output could be verified by reasoning, or comparison with documentation.
3.6.4 Documentation
The documentation is produced by first documenting each interest area in an appendix. Based on purpose and problem definition, the chapter on results, is derived. The rest of the thesis was then assembled progressively.
This chapter, gives a brief description of surveillance systems, defines commonly used terms, and describes some different technologies which are used in surveillance systems.
Traditionally, surveillance systems have relied heavily on ground infrastructure. This is the case with radar systems for aviation ( i e Air Traffic Control - ATC) and marine Vessel Traffic Service centers (VTS). A surveillance system can encompass radar, voice communication, automated information services and navigational aids.
4.1.1 Purpose
The main purpose for having surveillance systems, is enhanced safety for personnel and materiel, but environmental issues are also important. Transportation of humans and goods have an impact on the environment, which must be minimized. A well functioning surveillance system will help to avoid traffic conflicts and possible disasters. It may also allow vessels to travel a more direct route and thus using less fuel. Unfortunately, due to the shortcomings of current systems, the opposite often occurs. The vessels must follow assigned detours, since the surveillance system lacks coverage in certain regions.
4.1.2 New Systems
New technology is readily available for implementation as a replacement or complement to radar. Global Navigational Satellite Systems (GNSS), such as the GPS (controlled by the USA) or GLONASS (controlled by Russia) allow a vessel to establish its own position anywhere on the globe. A position sensor, such as a GNSS receiver, is needed. A vessel can be equipped with a system which continuously receives its own position, from the position sensor, and then repeatedly broadcasts it on a VHF data link. This concept works globally, regardless of ground infrastructure.
In the aviation environment this is called Automatic Dependent Surveillance Broadcast, or ADS-B. In the maritime environment, this is called Automatic Identification System, or AIS. These systems are called Broadcast Systems in this document.
A broadcast system supplies communication, navigation and surveillance (commonly called the CNS concept) to the user.
4.1.3 Standardization Process
Both the aviation and maritime community has acknowledged the need for new technologies in order to meet the traffic demand of the next century. Great effort is spent to derive standards which define the behavior and use of broadcast equipment.
In the International Civil Aviation Organization (ICAO), the Aeronautical Mobile Communication Panel (AMCP) is working on a draft Standards and
Recommended Practices (SARPS) called VDL Mode 4 [ICAO AMCP].
The International Maritime Organization (IMO) is the maritime equivalent of ICAO. IMO has specified draft performance standards [IMO Nav 43] for a Shipborne Universal AIS.
In both of these processes, the GP&C system (see appendix A) has had great influence. Contributions, well worth mentioning, are Time Division Multiple Access (TDMA), for transmission synchronization, and the self-organizing algorithm (STDMA) for sharing and organization of the VHF data link.
4.2 Organization
For the purpose of data link communication, the term organization has a special definition:
The process, in which stations select their transmission schedule, adhering to other stations, while avoiding and resolving transmission conflicts.
This definition implies that the data link is shared among several independent stations.
The data link can be categorized based on its mode of operation, which is defined as:
the method used in order to create a transmission schedule for repetitive transmissions.
The figure below illustrates the different modes of operation:
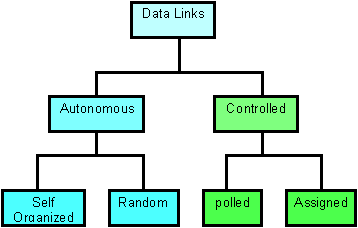
Figure 4.3.a
The mode of operation applies to transmission of repeatable character, such as position information.
It means that, while one mode is used for continuously transmitting position reports, another mode can be used for transmission of other information.
4.3.1 Autonomous Mode
In the autonomous mode of operation, each individual station is responsible for organization, and thus determines its own transmission schedule. Two techniques can be distinguished in autonomous mode: self-organized and random mode.
4.3.1.1 Self-Organized Mode
A station, which determines its own transmission schedule, based on some intelligent algorithm, is operating in a self-organized mode. This algorithm schedules transmissions, based on prior knowledge, of future activities, on the data link. It will organize the transmissions in order to avoid transmission conflicts, and to quickly resolve conflicts when they do occur. The primary mode of operation, in the STDMA system, is self-organized mode but, it can also be put into an assigned mode (see section 4.3.2.2).
4.3.1.2 Random Mode
A station, which determines its own transmission schedule on some algorithm, disregarding current and future data link traffic, is operating in random mode. In this mode, the station will schedule its transmissions purely based on randomization around some given criteria. It will transmit even though other stations might be doing the same simultaneously. Mode S Squitter [V. Orlando et al], Pure Aloha and Slotted Aloha [G. Maral et al] are examples of systems which operates in random mode. Conflict resolution is based on random behavior which statistically ensures that, at least some transmissions, will be successfully received.
4.3.2 Controlled Mode
In the controlled mode, a master is responsible for scheduling transmissions. Some systems may use a quasi-controlled mode, in which a station assumes control, based on some criteria, in lack of a master. Even though advocates of such systems may argue that they operate in autonomous mode, they are in fact operating in controlled mode since scheduling is controlled by one station; the current master. One example of a quasi-control system, is the AIS CS/TDMA system [MCC].
4.3.2.1 Polled Mode
The polled mode is a controlled mode, where the master interrogates other stations. One interrogation results in one, or more responses. If a station is not interrogated, it remains silent. The radar system operates in polled mode since the radar interrogates and receives a response in the form of an echo and a secondary radar response.
4.3.2.2 Assigned Mode
The assigned mode is a controlled mode, where the master assigns a transmission schedule to other participating stations. This schedule is generally valid for a limited time, after which the master must re-assign the schedule. The assigned mode is more efficient than polled mode since one transmission, from the master, results in a transmission schedule, which will operate for quite a while. The STDMA system can operate in assigned mode.
The GSM system, for cellular mobile phones, is an example of a system, which operates in assigned mode.
4.4 Synchronization
The STDMA system shares the data link by dividing time into slots (Time Division Multiple Access - TDMA). A position report fits into one slot. A set of slots is grouped in a frame. A frame is one minute long. The term synchronization is thus defined as:
The process, in which a station aligns itself in time, with other stations, in order to enable Time Division Multiple Access to the data link.
A very accurate source, for synchronization, is the 1PPS pulse from a GNSS receiver (see Appendix A). Other sources can also be used. Stations can synchronize their clocks to transmissions from semaphore stations. The semaphore station is responsible for providing timing simply by transmitting some synchronization message at specific intervals.
The semaphore scheme uses elaborate algorithms in order to select semaphore and to maintain synchronization [IALA].
4.5 Capacity
Capacity is defined as:
Measurement of how many stations the system can handle, and how well it handles overload.
In a TDMA system, it is quite easy to calculate how many stations that can be simultaneously handled. Assume that each station has a given report rate (RR), in transmissions per minute. One minute is equivalent to a set of slots (SL). The number of possible stations is then SL/RR. This, however, is only partly true. The reality is more complex.
A surveillance system can not have restrictions which specifies a maximum number of stations. The system must be able to handle overload (i e more slots required than currently available), and to adapt to the traffic, in a controlled and safe manner.
A TDMA system divides the communication channel in time, by first specifying a frame. The STDMA frame is one minute long. The start of a frame can be different between stations, but all stations strive to coordinate the frame start to Coordinated Universal Time (UTC).
The frame is divided into time slots. The start of each slot is an opportunity for a station to transmit. The slot start shall be the same for all participating stations. The current time slot, is the slot in which a station currently is receiving or transmitting. All stations are thus always at the same current slot, though they may have numbered it differently because the frame start differs.
4.7 Report Rate
Each station will transmit its position at some given time interval. The report rate is specified as the number of transmitted reports per minute. The report rate may differ between stations. Depending on factors such as speed or change of course.
There are two types of report rates:
Nominal report rate, which is defined as the report rate currently used by a station (or transmission attempts in a given time interval).
Net report rate, which is the experienced report rate (or successfully received transmissions) at a receiving station. Due to slot reuse, and other disturbances, a station may receive less reports than actually transmitted.
The net report rate may vary even though the nominal report rate remains fixed.
4.8 Net Throughput
Net throughput is defined as:
The relation between a nominal report rate, output by a transmitter, and the experienced report rate, from that same transmitter, at a receiver.
The net throughput can be derived, by dividing the number of successfully received transmissions, with the number of transmission attempts. This assumes that one transmission occupies exactly one slot.
The Self-Organized Time Division Multiple Access (STDMA) algorithm enables a self-organized autonomous mode of operation. A brief description follows below, based on information from [IALA].
4.9.1 The Comm State
Each station will continuously broadcast its position using a transmission packet, which occupies one time slot. The time slot is selected using STDMA. In addition to the position, the transmitted packet will also contain a Comm State.
The Comm State contains information, which states the intention of the STDMA algorithm:
Slot Time-out, which indicates how many more minutes the slot will be occupied.
Slot Offset, a relative offset to the next slot to be used the following minute. The slot offset is ignored unless the Slot Time-out is zero.
4.9.2 Initialization Phase
When a station first powers up, it will begin an initialization phase, which takes one minute. During this minute, the station will monitor the data link to determine channel activity, other, participating, stations and current slot assignments. After the first minute, the station enters the Network Entry Phase.
4.9.3 Network Entry Phase
During the network entry phase the station selects its first transmission slot and prepares to make itself visible on the data link.
It first determines its Nominal Increment (NI). The NI is equal to the number of slots per minute divided by the desired report rate.
To select the first transmission slot, the station selects a Nominal Start Slot (NSS). The NSS is randomly selected from the current slot and NI slots ahead in time.
After this, a Selection Interval (SI) is determined. The SI is always 20% of NI and placed so that the NSS is in the middle.
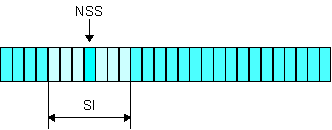
Figure 4.7.3.a
A slot is randomly selected within the SI. This slot is checked to see if it is available for use. If not, the adjacent slot to the left and right is checked. This process is continued until an available slot is found within SI. There shall always be a set of available slots. If the link is approaching maximum capacity, slots are reused from stations at the greatest distance, from the own position.
The selected slot becomes the Nominal Transmission Slot (NTS).
Upon reaching the NTS, the First Frame Phase is entered.
4.9.4 First Frame Phase
During the first frame phase, the station continuously allocates its nominal transmission slots (NTS) and transmits its position. Each NTS is allocated a unique slot time-out between 4 and 8 minutes.
Upon reaching the first NTS, a new Nominal Slot (NS) and NTS is selected for the following transmission. The NS is selected by adding NI to the NTS (or the latest NS, as applicable).
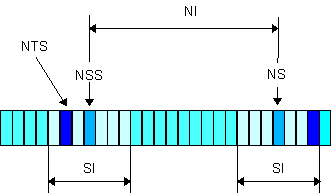
Figure 4.7.4.a
A new SI is placed around the NS and the NTS is allocated as described previously.
This process is continued until one minute has elapsed and the initial NSS is approached again. At this stage the station enters the Continuous Operation Phase.
4.9.5 Continuous Operation Phase
In the Continuous Operation Phase, the station transmits in the allocated NTS’s and decrements the slot time-out. When the time-out reaches zero, a new NTS is selected within the SI as described above. The relative offset (slot offset) is inserted into the position report packet and transmitted so that receiving stations are made aware of the intentions.
This phase is maintained until the system is shut down, enters assigned mode (see section 4.3.2.2) or changes reporting rate.
5 Results
The results, presented in this chapter, are described in details in chapter 8, Appendices.
This section is based on the analyses described in Appendix B.
5.1.1 Power Dissipation
This analysis examines the factors, which affect the range of radio waves in space (for details, see 8.2.2), omitting such factors as terrain and atmospheric effects. This is a desktop analysis based on available theory on the subject.
Given the characteristics of the GP&C transponder system (see 8.2.2.3), the following equation is derived:

Symbol |
Unit |
Description |
PR |
Watt |
Minimum required power at the receiver |
PT |
Watt |
Output power at the transmitter |
G |
Decibel |
Antenna gain. Transmitter and receiver are assumed to have the same gain. |
R |
Meter |
Resulting range. |
Table 5.1.1.a
The following values are inserted into the equation:
Symbol |
Value |
PR |
10-14 Watts. |
PT |
5 Watts. |
G |
-5 dB (equivalent to 10-0.5) |
Table 5.1.1.b
The resulting range (R) then becomes 1125 km (608 nm). With a gain of -15 dB, the range becomes 113 km (61 nm) or 1/10 of the range at -5 dB.
The gain greatly affects the result. It shall be noted that only gain in a horizontal direction is considered. The gain in vertical direction is generally much less, but considering the surveillance application, that is of little importance. Stations are generally spread in the horizontal plane to such an extent, that the vertical plane can be neglected. This is especially true in maritime environments, where the vertical separation is virtually nil.
5.1.2 Radio Propagation
This analysis examines how the radio waves propagates through the atmosphere, considering frequency characteristics and terrain (for details, see 8.2.3).
Radio waves, in the Very High Frequency (VHF) domain (30 to 300 MHz), primarily travel as space waves (i e the most prominent path is a direct line between transmitter and receiver).
The radio waves thus have line-of-sight reach. To calculate the farthest distance between two stations, the following equation is derived:

Symbol |
Unit |
Description |
D |
km |
The maximum distance between two stations. |
h1 |
meter |
The height above mean sea level (MSL) for the antenna of station 1. |
h2 |
meter |
The height above mean sea level (MSL) for the antenna of station 2. |
Table 5.1.2.a
5.1.2.1 Aviation Environment
In the aviation environment, the coverage is studied depending on a sub-environment (see section 8.2.3.5.5) as listed below:
Sub-environment |
Min |
Max |
Enroute |
3,000 m |
20,000 m |
Terminal |
1,000 m |
3,000 m |
Airport |
5 m |
1,000 m |
Table 5.1.2.1.a
Each sub-environment has a minimum and maximum altitude. It can be assumed, that the height of an aircraft, is equal to the height of the antenna.
A base station, positioned at 20 meters MSL, will have the following range:
Sub-environment |
Min |
Max |
Enroute |
213 km |
525 km |
Terminal |
130 km |
213 km |
Airport |
24 km |
130 km |
Table 5.1.2.1.b
Mobile stations (i e aircraft) flying at equal altitudes, will have the following range:
Sub-environment |
Min |
Max |
Enroute |
394 km |
1018 km |
Terminal |
228 km |
394 km |
Airport |
16 km |
228 km |
5.1.2.2 Maritime Environment
In the maritime environment, altitude can only be affected by the height of the antenna. For these reasons, it is assumed that a base station antenna is positioned at 150 meters above mean sea level (MSL). The antenna, of a ship, is positioned at 30 meters MSL. Based on this:
The base station will then have a range of 64 km (34 nm).
Two mobiles will come into range at a distance of 39 km (21 nm).
5.1.3 Discrimination
This analysis examines how well transmissions are received in situations where conflicts occur (i e several stations use the same time slot). For details, see section 8.2.4. The analysis is based on laboratory and practical tests described in appendix B.
The analysis show that the power ratio (i e the difference in power between two interfering stations) affect the capability of a receiver to successfully receive one of the transmissions.
If it is assumed that, all participating stations, radiate the same transmit power, The power ratio can be converted into a distance ratio. The following equations are used for this:
PR = 20 log( DR ) [Eq B.11]
![]()
Symbol |
Description |
PR |
Power Ratio. Specified in decibels (dB). |
DR |
Distance Ratio. |
Table 5.1.3.a
The radio signal is modulated, using Frequency Modulated, Gaussian Minimum Shift Keying (FM/GMSK). This modulation technique results in a worst case power ratio of 5 dB (see 8.2.4.5.1). This equates to a distance ratio of 1.8.
For the purpose of further analysis, the power ratio will be assumed to be 6 dB, and thus the distance ratio is 2.0.
This can be illustrated with the figure below:
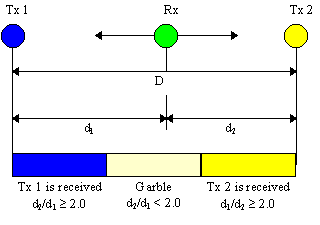
Figure 5.1.3.a
The term garble means, that neither station is successfully received by Rx. When one station is successfully received, that station is said to have discriminated the other.
This section is based on the analyses described in Appendix C and is a desktop analysis, supported by simulation in C/C++, of specific behavior. See the appendix, for details.
Radio waves propagates through the air, roughly at the speed of light (300 meters per microsecond). This is accounted for in the time slots, by a propagation buffer. This buffer ensures integrity, for the transmitted packet (called guard distance), for up to 370 km (200 nm). This is approximately 1/3 of the theoretical range in free space (see section 5.1.1). The STDMA system allows a transmission to overlap slot boundaries, but it could be a cause of transmission conflicts with stations, transmitting in adjacent slots.
When conflicts do occur due to propagation overlap, they will always result in discrimination (see section 8.3.6.2), whereby the closer station is successfully received.
When the required capacity approaches the theoretically maximum available, the cell size is reduced, and stations outside the guard distance are always discriminated.
5.3 Synchronization
This section is based on the analyses described in Appendix D, and is a desktop analysis, supported by simulations of specific behavior. See the appendix for details.
It describes the dynamics of a system, which resorts to other means of synchronization, than the primary source (such as the 1PPS from a GNSS receiver). The assumptions are based on requirements found in the VDL Mode 4 draft SARPS [ICAO AMCP].
It is assumed that base stations always have access to a primary time source with an accuracy of 1 microsecond and, that they can provide own position with high accuracy.
The analysis show that a synchronization jitter of approximately 13 us is introduced, when synchronizing to transmissions from a base station. This is equivalent to 3.9 km. The guard distance is thus reduced by approximately 1%.
In the maritime AIS system, the requirement on timing sources is less stringent. The cell size is always restricted by line-of-sight distances, which are around 64 km or less (see 5.1.2.2 above). This is only 20% of the guard distance.
5.3.2 Synchronization to a Mobile Station
It is assumed that mobile stations always have access to a primary time source with an accuracy of 1 microsecond, but only have access to own position with low accuracy.
The analysis show that a maximum jitter of 15 us is introduced. This is equivalent to 4.5 km. The guard distance is thus reduced by approximately 1.2%. This is only slightly less than when synchronization is derived from base stations.
5.3.3 Floating Network
A floating network exists when all participants on the data link have lost their primary time source and must adopt to some sort of fallback mode for time synchronization.
5.3.3.1 Base Stations Available
It can be assumed that base stations know their position (it is always fixed and has been surveyed), and also have access to an independent primary timing source. If mobiles can receive base stations, the situation is identical of the one found in 5.3.1 and thus those result apply.
5.3.3.2 True Floating Network
When a population of mobile stations have lost primary time source and are unable to receive transmissions from base stations (such as over an ocean) all sources of time are lost. This is a true floating network.
5.3.3.2.1 Synchronized and then Loosing Timing
If a station has been fully synchronized to the primary time source and then suddenly loses it, it will maintain a very accurate synchronization for quite some time. A design which drifts approximately 3 us per minute is realistic to achieve [GP&C/S 2]. If a station maintains a lost sync state for an extended period of time, the cell radius will gracefully be reduced. Assuming, in worst case, that transmissions, in adjacent slots, drift in opposite directions, the system will still be operable for an additional 3 hours, or more.
5.3.3.2.2 Primary Time Source is Unavailable
If it is assumed that the system lacks the very accurate, primary time source (such as the 1PPS provided by a GNSS receiver), the system must rely totally on some sort of fallback mode. Appendix D examines a method, whereby all stations perform arrival time measurements of received transmissions. The arrival times are then used in order to derive an average transmission time, which is then used for own transmission.
The analysis show that, for one population, all stations will strive towards a common transmission start time, and thus float in time with very little timing jitter and small overlaps in time slots.
Even if two separate populations are allowed to merge, they will tend to strive towards a common, floating time base.
5.4 Organization
This section is based on analyses described in appendix E and is a pure desktop analysis, based on the results from previous sections. The method of organization, provided by the STDMA algorithm, is examined to see how well it operates in an overloaded system and how it works together with other features of the STDMA system (such as discrimination).
5.4.1 The VHF Cell
For purpose of analysis, the VHF cell is approximated as a cylinder, with its radius extending to the horizon or, to the range given by link budget.
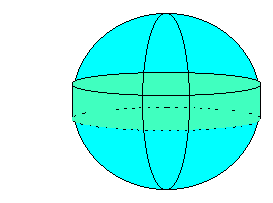
Figure 5.4.1.a
The horizontal distribution is far greater than the vertical. Therefore, the vertical distribution is disregarded.
Since the stations are distributed geographically, each VHF cell is unique. This reduces the ability of the STDMA algorithm to maintain organization.
5.4.2 Slot Reuse
In a cellular system, the frequency resource is shared and reused. The sharing is in time, using time slots. Reuse is performed when two or more stations use the same time slots for transmission. Two types of slot reuse can be distinguished in the STDMA system:
Automatic slot reuse, where two or more stations, unintentionally attempt to use the same time slot for transmission. The stations are unaware of each other’s action.
Intentional slot reuse, where stations reuse time slots, known to be reserved by other stations. The decision to reuse the time slots, is based on distance from own position.
5.4.3 Garble and Discrimination
Intentional and automatic slot reuse can produce one, of two results, at a receiving station:
Garble, where none, of a number of transmissions in a time slot, was received correctly at a receiver.
Discrimination, where one, of a number of transmissions in a time slot, was received successfully at a receiver.
Distance ratio is used when determining whether slot reuse results in garble or discrimination. The distance ratio can be converted to a power ratio, which is assumed to be 6 dB. This equates to a distance ratio of ½ (see also Appendix B).
5.4.4 Remote Area Operation
In remote areas, there is little, or none, data link communication. Studying two vessels approaching each other, shows, that the probability of transmission conflicts, is extremely small.

Figure 5.4.4.a
The probability of n consecutive transmission conflicts is:
P(n conflicts) = 1 / [( SL-SI )( SI )n ]; [Eq. E.8]
Assuming that the Selection Intervals (SI), of both stations, overlap completely.
When the overlap is partial, the expression below can be used (courtesy of Professor Lars Zetterberg):
P(conflict) = [(2nS)/(SI)2n + ½(SI)n-1]/(SL-SI); [Eq. Ad.7]
In an example, with 2250 slots per minute, and an update rate of 12 reports per minute, the probability of 3 consecutive transmission conflicts is 2 * 10-7, or less. In other words: the probability of detection during this time is 99.99998%.
The example above shows that, even though two stations are within VHF coverage, the actual detection may be delayed somewhat. This can be visualized by a modified VHF cell. At high speeds, the cell is compressed in front of the stations.
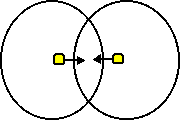
Figure 5.4.4.b
A transmission conflict is resolved after 4 minutes, on average. The conflict is isolated to a slot. Therefore, the receiving station will experience a reduced report rate, rather than 100% garble.
5.4.5 High Data Link Load
The data link is saturated when the required number of time slots is equal to, or higher than the available. Under these circumstances more slots may generally be needed than currently available, and slot reuse will take place.
5.4.5.1 Distribution
The primary results, presented in this section, are based on the assumption that participating stations are evenly distributed in space. Should this not be the case, the results will be affected (see also section 5.4.5.3).
5.4.5.2 Throughput Zones
A receiving station (R) is in the middle of a population of transmitting stations. Based on the distance between R and a transmitting station, the net throughput will vary, resulting in varying net report rate.
Three throughput zones can be identified:
the Aloha Zone,
the Discrimination Zone, and
the Protected Zone.
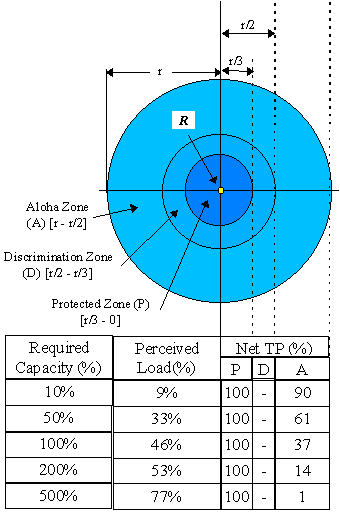
Figure 5.4.5.1.a
5.4.5.2.1 The Aloha Zone
The Aloha Zone (column A in the table in figure 5.4.5.1.a) stretches from r to r/2. Any time stations, within this zone attempts to reuse the same time slot, garbling will occur at R. The receiving station (R) will experience, that the transmitting stations, exercise slotted Aloha behavior. With an increase in required capacity, the time slot reuse is increased. Since this results in garble, the net throughput is decreased proportionally. Figure 5.4.5.1.a shows how net throughput is decreased with an increase in required capacity (see table at bottom of figure).
5.4.5.2.2 The Discrimination Zone
The Discrimination Zone (column D in the table in figure 5.4.5.1.a) stretches from r/2 to r/3. Within this zone, transmissions, in reused time slots, may result in garble or discrimination. The net throughput is increased, at R, as a transmitting station moves from r/2 towards r/3. Stations within the Discrimination Zone are able to receive each other, and are thus STDMA organized. Slot reuse then only occurs in time slots used by stations in the Aloha Zone. In figure 5.4.5.1.a, the table does not indicate a net throughput, but only a dash. The dash simply means that the net throughput is changing from the value in column A towards the value in column P.
5.4.5.2.3 The Protected Zone
The Protected Zone (column P in the table in figure 5.4.5.1.a) stretches from r/3 to 0 (zero). Within this zone, all stations are STDMA organized. Slot reuse will occur in slots used by stations in the Aloha Zone. Each time slot reuse occurs, it will result in discrimination, thus allowing closer stations to have 100% net throughput. The protected zone ensures good throughput between stations, which are close to each other.
5.4.5.3 Intentional Slot Reuse
It is assumed that a station will apply intentional slot reuse when all time slots appear to be reserved. Since some automatic slot reuse result in garble, a station will not detect that the data link is used to its maximum capacity until it has been overloaded to a certain amount.
There is a relationship between the required capacity and the perceived load. If it is assumed that all stations are uniformly distributed, the table below shows this relationship. The calculations are based on the throughput analysis in appendix E. It can be noted that the data link would have to be overloaded by approximately 700%, before intentional slot reuse starts to occur.
Required Capacity (%) |
Perceived Load at R (%) |
10 |
9 |
50 |
33 |
100 |
46 |
150 |
50 |
200 |
53 |
300 |
56 |
400 |
65 |
500 |
77 |
600 |
87 |
700 |
100 |
Table 5.4.5.2.a
At 700% required capacity, the effective cell radius has, since long, shrunk to r/2 (the net throughput, in the Aloha Zone, is only 1% at 500% required capacity already).
In the example above, the Aloha Zone will contain 75% of all stations, the discrimination zone will contain 14% and the protected zone 11%. If the distribution is the opposite, the perceived load would be 100% already when the required load is approximately 110%.
5.4.5.4 The Hidden User Scenario
The hidden user scenario, assumes that a station, has been isolated from all other traffic, and then suddenly reappear. This could be the case when a station is behind an obstruction where the VHF signals can not reach. When it appears, it is completely unorganized. Assuming that the appearing station is inside the protected zone, it will cause garble when reusing time slots from others within r/2 of R. It will discriminate others.
At the receiving station, the net throughput will be approximately 75% of nominal, assuming 100% required capacity. This reasoning is based on the fact that the protected and discrimination zones cover 25% of the whole VHF cell.
5.4.6 Assigned vs Autonomous Mode
The results, so far, have assumed autonomous operation using the STDMA algorithm. It is possible to achieve 100% throughput within all throughput zones, by allowing R to become a controlling base station. As a controller, R will assign a transmission schedule to all transmitting stations. This way, R will be responsible for resolving transmission conflicts. There are penalties associated with this.
5.4.6.1 Data Link Management
The controlling station must be allocated data link capacity for controller management. It must be able to transmit an assignment message, containing the transmission schedule, for each individual station.
5.4.6.2 Invisible Newcomers
If the data link is used to its maximum capacity, a new station, entering the cell, will be invisible to R until it reaches r/2.
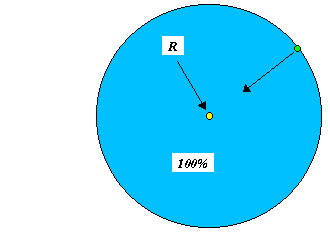
Figure 5.4.6.2.a
The reason being that all stations are now organized. The arriving station will reuse slots for each of its transmissions. While inside the Aloha Zone, the reuse results in garble 100% of the time. Important to notice, though, is that the station will be visible to other stations in its own vicinity.
This situation can be avoided by always having some spare capacity available.
5.4.6.3 How to Handle Overload
Since a controlled scenario must have spare capacity, overload is difficult to accommodate. The only way to handle that, would be to assign a lower reporting rate, as the required capacity is increased. This does not make sense, since a high report rate is desired when the traffic density is high.
5.4.6.4 Multiple Controllers
Assuming that a ground infrastructure exists, with controlling base stations. The base stations have partially overlapping VHF cells.
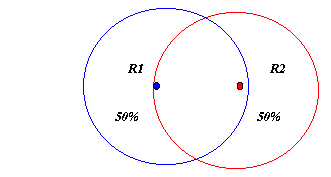
Figure 5.4.6.4.a
Coordination is necessary, if 2 or more controlling base stations are involved. Otherwise, stations in the overlapping region, could not be assigned slots so that both R1 and R2 successfully can receive them. Furthermore, stations in the vicinity will experience reduced throughput.
The only way to handle the overlapping area, will be to split the time slots between R1 and R2 (R1 would have access to 50% and R2 the other 50%). If a third base station would be involved, the split would have to be three ways. The result is, that there will be available capacity, which can not be used.
5.4.7 Ground Infrastructure
A control center, such as a VTS or an ATC, wants good throughput within its coverage area. This can be achieved in two ways, using stacked stations, or satellite stations. The two, can be combined as feasible.
5.4.7.1 Stacked Stations
By stacking stations, at the control center, and giving each stations a sector, the frequency resource can be reused. The sectors are created by the use of directional antennas.
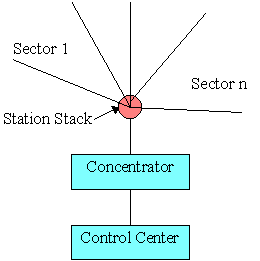
Figure 5.4.7.1.a
Each station will only receive transmissions from the sector covered by the directional antenna. There will be some overlap in adjacent sectors. This overlap adds redundancy, and thus safety, to the system.
The output, from the stacked stations, is input to a concentrator, which removes duplicate information prior to forwarding it to the control center. Each stacked station will have improved throughput in its sector. The net result is overall better coverage and throughput at the control center.
5.4.7.2 Satellite Stations
By connecting, geographically distributed stations, via a wide area network (WAN), the frequency resource can also be reused.
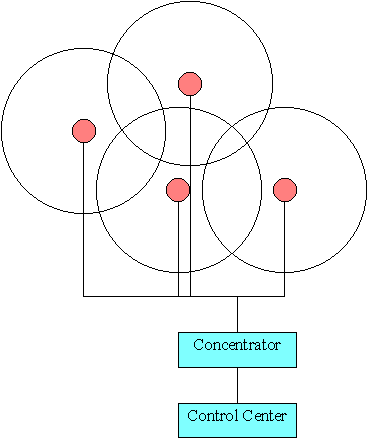 Figure 5.4.7.2.a
This scenario results in redundancy, since the VHF cells overlap partially. The concentrator removes any duplicates prior to sending the information to the control center. Each satellite station will have good throughput in its vicinity. The net result is better overall coverage and throughput at the control center.
The purpose of this thesis has been fulfilled since:
the terms capacity and throughput have been defined,
the dynamics and features, of the STDMA system, have been explored to great extent,
descriptive models for capacity and throughput, have been derived.
The problem definition has been answered since it is now possible to determine capacity and throughput, given a specific scenario. It is important, though, to consider the assumptions made in order to derive the analysis model.
6.2 Transmission Characteristics
6.2.1 Radio Wave Propagation
The limiting factor when determining cell radius, restricted by radio wave propagation, is line-of-sight. In the results, the power dissipation resulted in a theoretical range of 1125 km. The maximum line-of-sight distance was 1018 km (2 aircraft at 20,000 meters). Two aircraft would have to fly higher than 20,000 meters for the cell radius to be restricted by power dissipation due to radio propagation.
The line-of-sight characteristic of VHF, is crucial in an autonomous and cellular system. The cells are primarily restricted by line-of-sight, thus allowing reuse (multiplexing) of the frequency resource.
6.2.2 Discrimination
Discrimination is a key feature in an autonomous, cellular system and it cooperates with the line-of-sight characteristic to promote cellular operation.
The STDMA system has been analyzed with a power ratio of 6 dB (equates to a distance ratio of 2.0). This discrimination behavior depends on the following features:
Frequency Modulation (FM). FM is a robust method of modulating a radio signal, compared to Amplitude Modulation (AM), for example.
Gaussian Minimum Shift Keying (GMSK). GMSK is a robust method of modulating data. One symbol equals one digital bit. It works very well with FM to produce a robust radio signal. Forward error correction is not needed.
Packet Protocol. The packet protocol is based on the High Level Data Link Communication (HDLC) packet structure. The use of unique flags and bit stuffing enables the system to easily detect the start of a packet even while another packet is being received. The bit stuffing removes the need for bit scrambling.
Data Encoding. Non-Return to Zero Indication (NRZI) is used when encoding data. This works by giving a change in polarity when a digital zero is encountered in the data stream. NRZI allows the radio signal to average around a stable carrier.
Time Division Multiple Access (TDMA). TDMA ensures transmission integrity over large distances and reduces the probability of transmission conflicts (compare pure and slotted Aloha [G. Maral et al]).
Bit Rate. Assuming that the channel bandwidth shall remain at 25 kHz [IALA] [ICAO AMCP], the used bit rate affects discrimination. A higher bit rate will reduce the ability of strong discrimination.
Discrimination enables reuse of the frequency resource, even though stations are within line-of-sight. The strongest received signal can still be successfully received.
A low power ratio reduces garble and thus promotes throughput.
The STDMA system can handle transmissions from stations at distances greater than the guard distance (370 km). As the required capacity increases, more and more of the distant transmissions are discriminated, thus reducing the cell size of the receiving station.
A conflict, due to slot overlap, caused by propagation delay, will always result in discrimination of the farther station(s).
This fact is desirable in a cellular system such as STDMA.
6.4 Synchronization
Using fallback modes for synchronization, allows stations which lack accurate timing, to participate in the STDMA system anyway.
When the GNSS system fails, the STDMA system will degrade gracefully, allowing the participating stations to enter into a floating network gradually.
The analysis, in appendix D, examines two merging populations. This may very well work fine, but the scenario becomes quite complicated when additional, independent populations merge.
6.5 Organization
The STDMA system thrives on cellular operation and slot reuse. The STDMA algorithm cooperates with strong discrimination to provide a protected zone close to each individual station. This zone ensures slot integrity and safe delivery of time critical information.
6.5.1 Remote Areas
In remote areas, with little data link traffic, the probability of transmission conflicts, is very small. If a conflict should occur, it will be isolated to one slot. Since position reports are repeatedly transmitted, the same, or similar, information is transmitted over and over again, in other slots. This makes an isolated transmission conflict non-critical.
6.5.2 High Data Link Load
The three throughput zones (Aloha, Discrimination and Protected zone) automatically adjust the net report rate. At long distances the net report rate is low. As the distance is shortened, the net report rate is increased. This is achieved without any change of nominal report rate. This behavior is desired, since a distant station is less of a threat than a close station.
As the data link overloads, the VHF cells shrink. The size, of protected zone, is maintained until the data link overloaded by almost 700% (assuming even distribution of stations). When intentional slot reuse is applied, the protected zone shrinks to r/9.
Assuming that all stations report 12 times per minute, 700% equates to 2625 stations within the region covered by the VHF cell (2 channels using 2250 slots per minute). Since the throughput from the Aloha zone, is zero, the cell radius is down to r/2 with 656 stations visible to the receiving station (25% of the whole region). Of these 656 stations, 291 stations have a net report rate equal to the nominal report rate (i e 12 reports per minute).
6.5.3 Operating Modes
A surveillance system must allow overload, by gracefully degrade in a safe and controlled manner. By using autonomous mode, all stations can maintain their report rate, even when the data link is overloaded.
The primary mode of operation should always be autonomous. Assigned mode should only be used when a controlling authority wants to "highlight" a specific traffic situation.
6.5.4 Ground Infrastructure
The ground infrastructure should be designed and based on autonomous mode. Factors, to take into account, are traffic density, geography and desired throughput. A control center can monitor a large area, not limited by a single VHF cell. Mobile stations can operate within the control area, regardless of how the ground infrastructure is designed.
During 1994, the Swedish CAA conducted a live test at the Landvetter Airport. The test included approximately 35 vessels, equipped with GP&C transponders, and one base station. The test proved that autonomous operation was possible through the STDMA algorithm. In 1994, autonomous operation was a fairly unknown concept and met with some skepticism. In 1997, the IMO [IMO Nav 43] specified that the primary mode of operation shall be autonomous. It appears as if the importance of autonomous operation is now widely accepted. The results, from this thesis, underline that.
The analysis model assumes a smooth surface with evenly, geographically distributed stations. Altitude variations, between stations, are neglected. In reality, the traffic density will vary. Some areas will have very little traffic (in the middle of the ocean, for example), other areas will have a concentration of traffic (a harbor or an airport, for example). This will affect the dynamics of capacity and throughput.
The only way to study the dynamics, would be simulations where the traffic situation is allowed to vary over time. The net throughput will then vary with the traffic situation. The analysis model is still quite useful, though. When studying a specific region, based on a documented traffic density, that density could be increased. By doing that, a worst case concentration, of vessels, can be assumed in the whole region. The results from such an analysis will be very conservative and certainly applicable in the whole region.
7.3 Common Issues
7.3.1 Transmission Conflicts
When stations are partially organized, the system will behave as a slotted Aloha system within the Aloha Zone. This behavior is desired since it allows transmissions to be successfully received even in an overloaded system.
Some other studies, such as [V. A. Orlando] and [R. E. Boisvert] have come to other conclusions. Orlando and Boisvert argue that a transmission conflict (i e a reused slot) will inhibit reception of the involved stations for 4 to 8 minutes. This, regardless of data link load. It appears as if they believe that a transmission conflict is propagated to all time slots, occupied by the involved stations.
A transmission conflict is only isolated to one time slot. The next transmission may very well be received successfully.
Should a conflict occur in a slot, it will be resolved in 0 to 8 minutes, not 4 to 8.
7.3.2 Garbling
Orlando and Boisvert also present results, showing that all transmissions, in the Aloha zone, result in garble, regardless of data link load. This is contrary to the results presented in this thesis. The Aloha system is well documented and understood. Maybe the similarities with the STDMA system, were not fully explored.
7.3.3 Propagation
The propagation buffer provides integrity for up to 202 nm. Should two stations be separated by a greater distance, transmissions will overlap into adjacent slots. Depending on the data link load, these transmissions may still be received. Orlando [V. A. Orlando] indicates that the slot overlap is a problem. On the contrary, this is the desired behavior of a cellular system. The cell size shrinks with increased load. A ground infrastructure will still cover a large area, by the use of interconnected satellite stations. This architecture shall be based on the anticipated traffic density in the region.
7.3.4 Modulation and Bitrate
The SARPS [ICAO AMCP] specify GMSK/FM and D8PSK for modulation. D8PSK is not a feasible modulation method due to its poor discrimination capabilities [L. Johnsson].
The GMSK/FM modulation is combined with a bitrate of 19.200 bps. It is important to produce equipment, which can operate at 19.200 bps and maintain a 25 kHz channel bandwidth. The anticipated power ratio is 7 dB [ICAO AMCP], but that must be validated. It may be necessary to relax the channel bandwidth requirements somewhat, in favor of strong discrimination. The environment must also be taken into consideration. Unwanted disturbances, such as interfering radio equipment and multi-path, must be considered.
7.4 Abnormalities
This thesis has only looked at the situation when primary time source is lost. Other abnormal situations may also occur. Transceiver failures which may disturb the communication are not covered, for example. A deeper study of this may result in the need to specify additional system requirements, in order to minimize the probability of abnormal behavior.
8.1 A - The GP&C System
8.1.1 Introduction
This appendix summarizes the GP&C system with respect to the problem it is trying to solve and its basic functionality. The GP&C system is an implementation of a broadcast system using STDMA.
8.1.2 Basic Assumptions
It is assumed that the patent [EPO] describes the key issues and, that current implementations of the system are based on the assumptions and requirements stated in the patent documentation.
8.1.3 Analysis 1: The Invention
8.1.3.1 Objective
The objective of this analysis is to analyze the patent in order to describe:
the problem that the invention solves,
the conceptual ideas of the invention,
the implementation details of the invention.
8.1.3.2 The Problem
The GP&C system attempts to satisfy communications requirements found in aviation, maritime and land-mobile environments. The common scenario, in these environments, is a population of independently moving objects with a need to exchange information (primarily position information). Base stations, which monitor the communication, can also be part of the scenario.
Radar (Radio Detection And Range) and voice radio is the traditional solution to this communication need. But, the need to communicate extends farther than the range of radar. Because of the limitations of radar, aircraft, for example, are required to fly dedicated paths, with certain spacing between them. This is expensive for the airlines and introduces delays because of heavy air traffic. The GP&C system operates autonomously, allowing two aircraft to exchange information anywhere on the globe. If this information is position information, the aircraft could monitor the traffic and decide its path based on cost and current traffic in the area.
The maritime and land-mobile environments have similar needs.
8.1.3.3 Conceptual Ideas
This section describes the key concepts of the invention, as written in the Swedish patent.
8.1.3.3.1 Position Sensor
The system is described as a population of moving object which, all know their position by receiving signals from geographically distributed transmitters (GDT:s). The position of each GDT is known by the moving objects.
8.1.3.3.2 VHF Transceiver
Each moving object is equipped with a Very High Frequency (VHF) transceiver which is used in order to communicate the own position and other relevant information. All moving objects share a common frequency channel.
8.1.3.3.3 Time Base
The GDT:s, which are used for positioning, also provide a time base to the moving objects. The time base is used to divide the common frequency channel into time slots.
8.1.3.3.4 Channel Access
The communication channel is divided into a frame, consisting of a pre-defined number of time-slots.
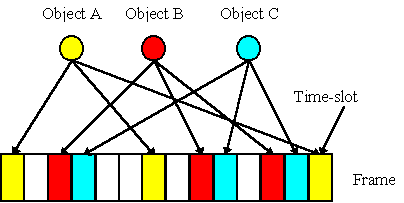
Figure 8.1.3.3.4.a
Each moving object is able to autonomously allocate slots within the frame. The slots are then used by each moving object, to communicate the own position, and other, relevant information.
8.1.3.3.5 Cellular Concept
Each moving object operates in a communication cell. An object is primarily interested in other objects within its vicinity. The range of the radio wave shall thus be restricted. The system is recommended to use a frequency, which has line of sight restriction as its primary propagation characteristic. VHF frequencies are in the range 30 to 300 MHz [L Ahlin et al].
8.1.3.3.6 Slot Allocation
Slots can be allocated autonomously or via master control. When an object allocates slots autonomously, it will primarily select unused slots. If the data link is saturated, it will employ a slot reuse algorithm and reuse slots, occupied by objects, which are far away.
When a master is introduced, it decides which slots to use by other objects.
The slots are used in order to broadcast the own position. Each object will have a default transmission rate, which can be changed automatically or via master control. The criteria, for changing transmission rate, is not defined.
8.1.3.4 Implementation Details
This section describes how a GP&C system can be constructed, using existing technology.
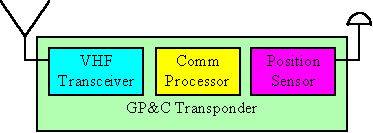
Figure 8.1.3.4.a
Figure 8.1.3.4.A illustrates the main components of a GP&C transponder.
8.1.3.4.1 Position Sensor
Position information is generally provided via a satellite navigation system, such as Global Positioning System (GPS) or GLONASS. GPS and GLONASS are jointly called Global Navigation Satellite Systems (GNSS). A GP&C transponder contains a GNSS receiver as a position sensor.
8.1.3.4.2 VHF Transceiver
The GP&C transponder is equipped with a VHF transceiver which is able to operate on channels with 25 kHz spacing. The radio can be keyed and de-keyed within 1 ms.
8.1.3.4.3 Communication Processor
The communication processor is a computer, which co-ordinates the use of the communication channel.
8.1.3.4.4 Time Base
The GNSS receiver provides a time base through its One Pulse Per Second (1PPS). This pulse is coordinated to Universal Time Coordinated (UTC).
8.1.3.4.5 Channel Access
The communication processor is connected to the VHF transceiver and the position sensor. The communication processor holds a virtual image of the time-slot frame in its memory. It will transmit the position information, from the position sensor, based on the timing information from the timing pulse (1PPS).
8.1.3.4.6 Cellular Concept
The VHF transceiver ensures that the cellular concept is fulfilled. Frequencies in the VHF band propagates with the characteristics of line of sight.
8.1.3.4.7 Slot Allocation
Slot allocation is controlled by the communication processor. It continuously updates the virtual frame image and allocates slots from free slots or reuses from stations, which are far away.
8.1.3.5 Comments
The unique feature, which makes the GP&C system possible to patent, is the synchronization mechanism. The GNSS system provides position information all over the globe. In order for the GNSS systems to work, time must be one of the dimensions. The GP&C system states that the time, from the same transmitters which give position, shall be used to synchronize the slots on the data link. Given this, a system scenario evolves. The scenario shows a globally functioning Communication, Navigation and Surveillance (CNS) system. This puts additional demands on the system functionality. The system must be able to operate autonomously, for example. The algorithm which allows an object to enter the system, resolve communication conflicts and share the data link resource, is a very important feature of the GP&C system.
8.1.4 Analysis 2: System Design
8.1.4.1 Objective
The objective of this analysis is to:
…study the resulting system design based on the claims in the patent.
8.1.4.2 Global Nature
8.1.4.2.1 Global Signaling Channel
The system claims to be operable globally. A common frequency around the globe supports the global concept. The frequency is called the Global Signaling Channel (GSC). The system would work with a mix of frequencies too.
By implementing a data link administration telegram, objects could be instructed to change to local frequencies. This implies that some sort of controlling station is part of the scenario.
8.1.4.2.2 The CNS Concept
The system provides a globally functioning system for communication, navigation and surveillance. This is commonly called the CNS concept.
Communication is provided by the data link synchronized to UTC.
Navigation is provided by, for example, the GPS system.
Surveillance is the result of participating objects which communicate their position on the data link. The surveillance function can be extended so that an authority and, or company can monitor traffic from a central facility. This is achieved by connecting GP&C base stations in a wide area network (WAN). The connected base stations become a ground infrastructure.
8.1.4.3 The Data Link
8.1.4.3.1 Time Division Multiple Access
The common frequency channel becomes a shared data link which is divided into time-slots. The data link is thus time divided. Since it also allows multiple access the link is called a TDMA link (Time Division Multiple Access). Access to the data link is given at the start of a slot, based on a slot selection algorithm.
8.1.4.3.2 Self Organized
The data link is organized so that a specified number of time-slots make up a repeatable frame. Each station can autonomously allocate and de-allocate slots within the frame. This makes the system independent from a ground infrastructure. The participating objects apply a slot allocation algorithm which is self organizing. This means that it allocates slots, de-allocate slots and resolves communication conflicts by itself. The selection algorithm is thus called Self Organized Time Division Multiple Access (STDMA).
8.1.4.3.3 Network Entry
An object, wishing to enter the data link network, will monitor the data link for a time equal to the length of a frame. During this time the object will create a virtual image of the data link traffic. After this, it will select slots for transmission. The slots are randomly selected with a spacing, which will allow the object to hold a pre-defined update rate (for example 12 reports per minute). If a randomly selected slot is busy, the object will look one slot ahead. If that slot is also busy, it will look one slot behind. It will continue this selection process until an available slot is found.
8.1.5 Getting Organized
Each selected slot is tagged with a time out. This time out is part of the transmitted telegram. The time out randomly selected and may be different for each slot. For each transmission, in the slot, the time out is decremented. When it reaches zero, the object calculates a new slot to use and adds a slot offset to the transmitted telegram. The slot offset specifies how many slots forward or backward the object intends to move its transmission in the next frame.
8.1.5.1.1 Conflict Resolution
By employing the STDMA algorithm, transmission conflicts are eventually resolved without intervention from controlling stations. Even though the data link is synchronized all over the globe, it would not operate unless it had a slot selection algorithm which supported the global concept.
8.1.5.1.2 Data Link Saturation
The position information has a central role in the system. This information ensures a graceful degradation in case of heavy data link traffic. When free slots are unavailable, objects will start to reuse slots from distant stations. This allows the system to adjust when the communication traffic is increased.
8.2 B - Transmission Characteristics
8.2.1 Introduction
This appendix presents analyses which look at factors and behavior surrounding the transmission and propagation of radio waves. Three areas are studied:
Power dissipation or link budget. Analysis of the factors affecting the power while the radio waves travel through the air.
Radio propagation. Analysis of the path of the radio waves.
Discrimination. Analysis of how conflicting transmissions discriminate or garble each other.
The purpose of these analyses is to give a background to the input used in the overall analysis of the STDMA system.
8.2.2 Analysis 1: Power Dissipation
8.2.2.1 Objective
The objective of this analysis is to:
…determine factors affecting the range of radio waves.
8.2.2.1.1 Scenario
A transmitter and receiver are placed in space. The only obstructions, between the two stations, are the vessels in which the transmitter and receiver are installed. The environment at the transmitter is identical to the environment at the receiver.
8.2.2.2 Expected Results
The analysis shall give an indication of how far radio waves can travel with respect to transmission power and other factors affecting radio wave propagation in the scenario described above.
8.2.2.3 Assumptions
1 |
Gain |
The gain at the transmitter is equal to the gain at the receiver since the environments are identical. |
2 |
Transmit Power |
5 Watts [GP&C/S 1] |
3 |
Receive Power |
10-14 Watts [GP&C/S 1] |
4 |
Frequency |
150 MHz |
5 |
Antenna |
An omni-directional antenna is used, tuned for 150 MHz. The length is ¼ of the wave length. |
Table 8.2.2.3.a
8.2.2.4 Method
This is a desktop analysis based on theory regarding calculation of link budget and the assumptions from table 8.2.2.3.a.
8.2.2.5 Results
8.2.2.5.1 Equation for Distance
The maximum distance (R), in free space, between a transmitting station and a receiving station is sought.

Figure 8.2.2.5.1.a
Equation B.1 below serves as the basis for the calculation [G. Maral et al].
![]()
PR |
Minimum required power at the receiver |
PT |
Output power at the transmitter |
GT |
Transmit gain |
GR |
Receive gain |
l |
The wave length |
Table 8.2.2.5.1.a
The wave length is calculated based on the equation B.2 below:
![]()
c |
The speed of light in vacuum |
2.99793· 108 m/s [L. Ekbom] |
f |
The used frequency |
150 MHz. |
Table 8.2.2.5.1.b
According to the assumptions (table B.1), the transmit gain (GT) and the receive gain (GR) are equal (labeled G). The basis for further analysis is then the equation below:

The values above give a l of approximately 2 meters.
By applying the assumptions and the derived l , equation B.1 can be simplified as shown below:

8.2.2.5.2 Equation Analysis
Looking at equation B.3, high transmit power, low minimum required receive power, high gain and a long wavelength, improves the range.
These parameters are analyzed in more detail below and also commented at the end of this chapter.
Parameter |
Comment |
High transmit Power |
High transmit power also results in higher temperatures and larger energy consumption. The surrounding environment must also be considered if the transmit power is considerable. Humans and/or material may be vulnerable to it. |
Low minimum required receive power |
This also means that the equipment is less tolerant to noise. A high noise level will require the sensitivity to be lowered. |
High gain |
The antenna dimensions, antenna cabling and its position affects the gain. |
Long wavelength |
Long wavelength equals low frequencies. |
8.2.2.5.3 Determine Gain
In order to apply equation B.4, the gain must be determined. The gain varies around the antenna. The gain can be positive and thus enhance the output power. It can also be neutral or negative.
The following is assumed regarding gain:
The surrounding environment is simple in its structure.
Only negative gain is considered.
Only transmissions, which travel in a horizontal direction, are considered.
Based on these assumptions, and the assumptions in table 8.2.2.3.a, a gain of -5 dB (10-0.5) is a realistic figure [Lennart Dreier, GP&C Sweden AB].
8.2.2.5.4 Resulting Distance
The maximum distance that the radio waves can travel is approximately 608 nm. If the gain is -15 dB instead of -5, the distance becomes 61 nm, or 1/10 of 608 nm. Diagram B.1 below illustrates how the distance varies with different values of gain:
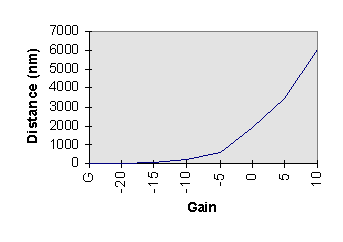
Diagram 8.2.2.5.4.a
8.2.2.6 Comments
This analysis omits factors such as atmospheric effects, multipath and interfering noise.
It does, however, give an indication of the theoretical range with respect to transmit power and the lowest acceptable receive power.
The effect of wavelength is interesting. A low frequency also allows low transmit power. This is in agreement with the GP&C system, which operates in the maritime and aviation VHF domain (107-174 MHz). It generally uses low transmit power (5 Watts). This can be compared to similar systems such as Mode S squitter, which operates on 1030/1090 MHz and uses high transmit power (1500 Watts) to achieve a range of 100 nm. [Orlando et al].
8.2.3 Analysis 2: Radio Propagation
8.2.3.1 Objective
The objective of this analysis is to:
…determine the range of the radio waves with respect to how the radio waves propagate through the atmosphere.
8.2.3.1.1 Scenario
Two stations, a transmitter and a receiver are placed in space with the earth as an obstruction.
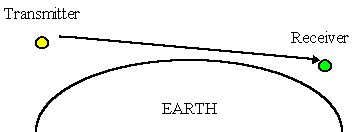
Figure 8.2.3.1.1.a
The radio waves from the transmitter propagates through the air to the receiver. Based on how the radio waves behave, the reception will be successful or fail.
8.2.3.2 Expected Results
The analysis shall result in an equation of how far the radio waves can reach, based on:
the earth as an obstruction,
the height of the transmitter and receiver,
how the radio waves propagates through the air.
8.2.3.3 Assumptions
1 |
Frequency |
The VHF frequency domain, 30-300 MHz [L Ahlin et al]. |
2 |
Earth Radius |
6370 km [L Ekbom]. |
3 |
Geography |
Obstructions, such as mountains, are not present. |
Table 8.2.3.3.a
8.2.3.4 Method
This is a desktop analysis of available literature. Equations are derived and compared with results in the literature.
8.2.3.5 Results
8.2.3.5.1 Propagation Path
VHF radio waves primarily travel as space waves [J.M. Ferrara]. This means that the most prominent path is a direct line between the transmitter and the receiver. The space wave component generally dissipates quickly. The radio waves can be said to have line-of-sight reach. Atmospheric conditions can cause the range to exceed beyond line-of-sight. This is generally called refraction [L Ahlin et al].
8.2.3.5.2 Line-of-Sight Equation
The figure below illustrates two objects in the atmosphere and the distance (D) between them.
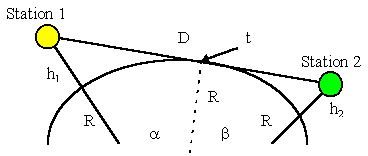
Figure 8.2.3.5.2.a
h1 |
The height above ground (in meters) for station 1. |
h2 |
The height above ground (in meters) for station 2. |
D |
The direct distance (in km) between station 1 and 2. |
R |
The earth radius (6370 km). |
T |
The point, where a direct line between the two stations, touches the horizon of the earth. |
b |
The angle between the right side radius line and the dotted line going to t. |
a |
The angle between the left side radius line and the dotted line going to t. |
Table 8.2.3.5.2.a
Based on the figure, the following equations are derived:
![]()
![]()
![]()
Further simplifications of equation B.7 results equation B.8:

8.2.3.5.3 Verification of Line-of-Sight Equation
8.2.3.5.3.1 Results from Other Sources
Equation B.8 uses a constant (k), which equals 3.6. In [L Ahlin et al, page 35] a similar equation is presented. The constant (k) equals 3.6 also (see also comments in section 8.2.3.5.4).
8.2.3.5.3.2 Alternative Equations
If it can be assumed that h1 and h2 are equal, the situation can be illustrated as shown in figure 8.2.3.5.3.2.a below:
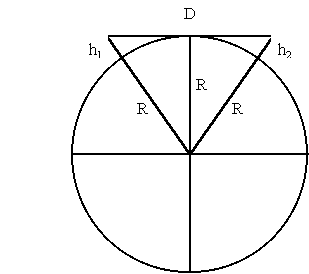
Figure 8.2.3.5.3.2.a
Since h1 = h2 = h, the following equation can be derived:

The distance (D) can be derived from equation B.9 and results in equation B.10 below:
![]()
Equation B.10 produces the same results as equation B.8.
8.2.3.5.4 Refraction
It has been assumed that the radio waves propagates in a straight line. This results in a distance as described in equation B.8. In this equation the constant (k) equals 3.6. If refraction is considered, the constant (k) becomes 4.1 instead [L Ahlin et al, page 35]. However, according to L Ahlin, it is not feasible to use this factor due to destructive interference, caused by multipath, for example.
8.2.3.5.5 Coverage
To study VHF coverage, the aviation environment is selected. Within aviation, three sub-environemnts are defined:
Enroute environment, which is where aircraft are enroute between departure and destination. Flight levels are generally high in this environment.
Terminal environment, which is where aircraft are approaching an airport in order to land.
Airport environment, which is where aircraft are either on ground at the airport, on final approach or, departing the airport.
The table below lists assumptions regarding altitude within the different environments:
Environment |
Min |
Max |
Enroute |
3,000 m |
20,000 m |
Terminal |
1,000 m |
3,000 m |
Airport |
5 m |
1,000 m |
Table 8.2.3.5.5.a
The altitudes are chosen based on how airspace is organized according to international civil aviation regulations.
8.2.3.5.5.1 Base Station Coverage
Base stations are generally positioned on the ground, in the vicinity of an airport or, along enroute segments in order to cover common airways. If it is assumed that a base station antenna generally is positioned 20 meters above ground, the following ranges can be expected (employing equation B.8):
Environment |
Min |
Max |
Enroute |
213 km |
525 km |
Terminal |
130 km |
213 km |
Airport |
24 km |
130 km |
8.2.3.5.5.2 Mobile Coverage
The range between mobile stations can be derived by assuming that two stations are at the same altitude.
Environment |
Min |
Max |
Enroute |
394 km |
1018 km |
Terminal |
228 km |
394 km |
Airport |
16 km |
228 km |
8.2.3.6 Comments
The results are based on a smooth surface and a globe which has a uniform radius (6370 km). In addition to this, multipath and refraction has been left out. In areas with none or few obstructions, the resulting range is likely to be longer than calculated. In areas with many obstructions the range will be shorter.
8.2.4 Analysis 3: Discrimination
8.2.4.1 Objective
The objective of this analysis is to:
…determine how radio signals are received when transmissions from several stations are in conflict.
8.2.4.1.1 Scenario
A receiver is placed in the middle of a population of constantly moving objects, equipped with transceivers. Some of the objects are un-organized and, as a result, transmission conflicts occur.
8.2.4.2 Expected Results
The analysis shall result in information which describe the dynamics of discrimination and garbling. Discrimination occurs when one, of two or more conflicting stations, is received. Garbling occurs when none of the conflicting stations are received.
8.2.4.3 Assumptions
1 |
Modulation |
Frequency modulation (FM) using Gaussian Minimum Shift Keying (GMSK). |
2 |
Bitrate |
9600 bps. |
Table 8.2.4.3.a
8.2.4.4 Method
This is a study of experiments performed in laboratory, land-mobile and aviation environments, found in [LFV Card 1].
In all three tests, the setup is similar to the one showed in figure 8.2.4.4.a below:
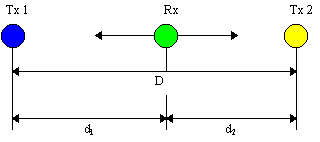
Figure 8.2.4.4.a
Two transmitters (Tx 1 and Tx 2). Are stationary and separated by a distance (D). A receiver (Rx) is allowed to move back and forth between Tx 1 and Tx 2. The two transmitters output position reports once per second, in the same time slots, thus inducing transmission conflicts. The number of successfully received position reports are measured at the receiver (Rx) while moving from Tx 1 to Tx 2. In the laboratory test, this is simulated by using attenuators.
A successfully received transmission depends on the ratio in power between Tx 1 and Tx 2. This ratio is called power ratio (PR). Tx 1 and Tx 2 use the same nominal transmit power. The power ratio can easily be converted to a distance ratio (DR), which describes the required separation between Rx to Tx 1 and Rx to Tx 2 (d1/d2). To convert between PR and DR, the following equations are used [LFV Card 1]:
PR = 20 log( DR ) [Eq B.11]
![]()
Power Ratio (PR) is expressed in decibels (dB).
8.2.4.5 Results
8.2.4.5.1 Laboratory Test
The laboratory test simulated the distance (D) and the position of Rx within D, by the use of a setup as shown in figure 8.2.4.5.1.A below:
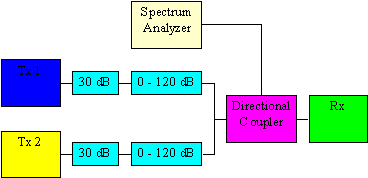 Figure 8.2.4.5.1.a
The test was performed using a signal strength of approximately -80 dBm. The test produced the following results:
PR |
Throughput |
DR |
3 dB |
0% |
1.4 |
4 dB |
30% |
1.6 |
5 dB |
100% |
1.8 |
Table 8.2.4.5.1.a
For a 100% success rate, a PR of, at least 5 dB must exist. This equates to a DR of, at least 1.8 (i e d1/d2 = 1.8 or higher).
8.2.4.5.2 Land-Mobile Test
The land-mobile test was performed using the setup described in figure 8.2.4.4.a above. Two transmitters (Tx 1 and Tx 2) were positioned at opposite ends of an airport runway. A receiver (Rx) was installed in a car and then allowed to travel between Tx 1 and Tx 2.
For a 100% success rate, a PR of, at least 0.8 dB must exist. This equates to a DR of, at least 1.1 (i e d1/d2 = 1.1 or higher).
8.2.4.5.3 Aviation Test
The aviation test was performed using the setup described in figure 8.2.4.4.a above. Two transmitters (Tx 1 and Tx 2) were positioned at two different airports. A receiver (Rx) was installed in an aircraft and then allowed to fly between Tx 1 and Tx 2.
For a 100% success rate, a PR of, at least 2.0 dB must exist. This equates to a DR of, at least 1.25 (i e d1/d2 = 1.25 or higher).
8.2.4.6 Comments
Only the laboratory test was conducted in a controlled environment. This test resulted in the poorest results (PR = 5 dB). The difference between the laboratory and the land-mobile and aviation tests can probably be explained by environmental causes, such as interfering obstructions, antenna positions a s o. For the purpose of analysis, 5 dB, or more, should be used.
In the ICAO draft SARPS [ICAO AMCP], a second modulation method (Digital Eight Phase Shift Keying - D8PSK) is specified. According to [R. E. Boisvert], this modulation method results in a PR of 18 dB, or a DR of 7.9. In general, a lower power ratio (and thus a lower distance ratio), will promote improved throughput. Therefore, D8PSK is not a feasible modulation method, compared to GMSK/FM.
8.3
8.4 C - Propagation and Slot Boundaries
8.4.1 Introduction
This appendix focus on how large distances, between communicating stations, introduce delays and, as a result, possible collisions in transmissions. The STDMA system has a built-in guard time (a buffer which protects data) in each slot, which allows stations to be 370 kilometers (200 nautical miles) apart. A station can still receive a transmission farther away, but that transmission will cross slot boundaries and potentially be in conflict with a transmission in an adjacent slot.
8.4.2 Objective
The objective of this analysis is to:
study how propagation affects throughput and cell radius when stations are far apart (more than 370 km) and the slot occupancy is less than maximum.
When stations are more than 200 nautical miles (nm) apart, their transmissions will overlap slot boundaries and thus no longer be protected within a slot. There is a probability that transmissions in adjacent slots will be in conflict.
Focus is only on propagation. Conflicts, due to stations not being STDMA organized, are omitted in the analysis.
8.4.2.1 Scenario
The figure below shows three circles. The inner circle (A) has a radius of 100 nm. The middle circle (B) has a radius of 200 nm and the outer circle (C) has a radius of 400 nm and is the total area in this analysis. The area of A is 1/16 of the total area. The area encompassed by B is 3/16 of the total area and the area C encompasses 12/16 of the total area.
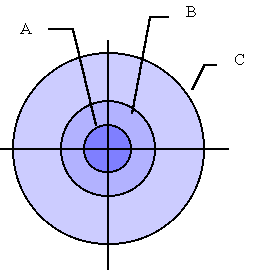
Figure 8.3.2.1.a
The total number of transmissions occupy all available slots, but initially only 5% of the transmissions are within 200 nm of the receiving station. The receiving station is positioned in the center and the throughput (i e correctly received transmissions divided by actual transmissions) to this station is studied. Any transmission inside the 200 nm radius is protected by the guard time. The stations are then slowly allowed to move into the 200 nm radius until 95% of all transmissions are within.
8.4.3 Expected Results
The analysis shall result in equations describing:
net throughput,
throughput in the area not covered by guard time (area C),
cell radius dynamics.
8.4.4 Assumptions
Guard time |
370 km (200 nm). |
Saturation |
Slot reuse is not necessary, i e there are free slots for every station in the scenario. |
Modulation |
GMSK/FM. |
Distance ratio |
½ in distance which, is equivalent to ¼ in power ratio. |
Slots |
4500. |
Channels |
1. |
Organization |
All station within 740 km (400 nm) are STDMA organized. |
Traffic |
The traffic is spread evenly within the areas. |
Table 8.3.4.a
8.4.5 Method
8.4.5.1 Pre-Study
The nature of propagation and discrimination is studied to determine the factors affecting the success of a transmission in a slot. Slots can be in 3 states:
Ok, meaning that a transmission in that slot was received successfully.
Garbled, meaning that two transmissions, in adjacent slots, were in conflict and neither transmission was received successfully.
Discriminated, meaning that two transmissions, in adjacent slots, were in conflict but one was successfully received and one was not (it was discriminated).
8.4.5.2 Deriving Results
An empirical method is used. A C++ program is created in order to retrieve results. The program constructs a virtual image of a traffic situation with stations randomly spread within a 400 nm radius of a receiving station. Each slot is assigned a distance to the receiver. Based on the distance, an analysis is performed to see if a transmission is in conflict with the previous transmission. If this is the case, the previous transmission is either discriminated or both transmissions are garbled. The program constructs the virtual image 1000 times and then calculates average values of slots which are okay, slots which are garbled and slots which are discriminated.
8.4.5.3 Creating Equations
The results from running the program are input to a spread sheet program. Diagrams are drawn and equations are derived based on the input and the diagrams.
8.4.6 Results
8.4.6.1 Slot Organization
The data link is time divided. This means that each transmission is allocated its own time slot. This analysis only looks at conflicts due to propagation. Therefore it is assumed that only one station transmits in each time slot. Conflicts will then only be possible when transmissions overlap slot boundaries at the receiving station.
8.4.6.2 Discrimination and/or Garbling
When a conflict is a fact it can either cause one transmission to be discriminated (i e 1 of 2 transmissions are received) or it can cause both transmissions to be garbled (i e 0 of 2 transmissions are received). To discriminate, the distance between the conflicting stations must be as described below:
Distance(Distant)/Distance(Close) >= 2 [Eq. C.1]
The figures below show different examples transmissions and propagation time.
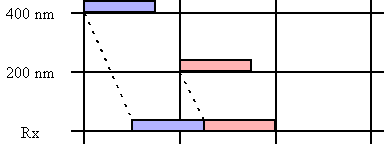 Figure
8.3.6.2.a
In figure 8.3.6.2.a the conflict is avoided since the transmission from the station at 200 nm results in a propagation which allows the station at 400 nm to overlap into the next slot but not overlap the transmission.
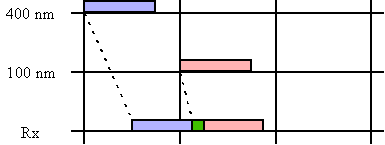 Figure
8.3.6.2.b
In figure 8.3.6.2.b the station at 100 nm overrides the station at 400 nm, thus discriminating that station (400/100> 2).
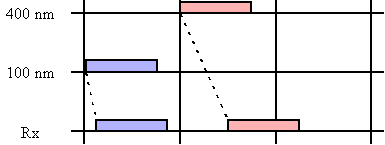 Figure
8.3.6.2.c
When the previous transmission is at a closer range than the following one, they are in fact separated and no conflicts exist (figure 8.3.6.2.c).
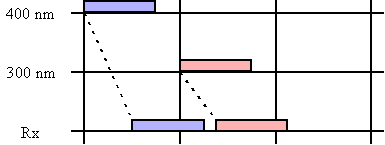 Figure
8.3.6.2.d
Using Eq. C.1 would result in garbling in the scenario shown in figure 8.3.6.2.d (400/300 < 2), but as can be seen, the propagation time separates the two transmissions.
Thus, garbling due to propagation time only, can never occur in the STDMA system.
Discrimination is the only factor limiting throughput in the non-saturated scenario with respect to propagation time.
8.4.6.3 Running the Test Program
The test program produces a list showing how many slots are discriminated depending on how many slots are within 200 nm.
% in |
slots | slots | slots | Discr. |
C |
Net |
AB |
A |
B |
C |
in C |
tp |
tp |
5% |
56 |
169 |
4275 |
79 |
98,15% |
98,24% |
10% |
113 |
338 |
4050 |
150 |
96,30% |
96,67% |
15% |
169 |
506 |
3825 |
213 |
94,43% |
95,27% |
20% |
225 |
675 |
3600 |
267 |
92,58% |
94,07% |
25% |
281 |
844 |
3375 |
313 |
90,73% |
93,04% |
30% |
338 |
1013 |
3150 |
351 |
88,86% |
92,20% |
35% |
394 |
1181 |
2925 |
380 |
87,01% |
91,56% |
40% |
450 |
1350 |
2700 |
400 |
85,19% |
91,11% |
45% |
506 |
1519 |
2475 |
413 |
83,31% |
90,82% |
50% |
563 |
1688 |
2250 |
417 |
81,47% |
90,73% |
55% |
619 |
1856 |
2025 |
413 |
79,60% |
90,82% |
60% |
675 |
2025 |
1800 |
401 |
77,72% |
91,09% |
65% |
731 |
2194 |
1575 |
379 |
75,94% |
91,58% |
70% |
788 |
2363 |
1350 |
349 |
74,15% |
92,24% |
75% |
844 |
2531 |
1125 |
312 |
72,27% |
93,07% |
80% |
900 |
2700 |
900 |
266 |
70,44% |
94,09% |
85% |
956 |
2869 |
675 |
213 |
68,44% |
95,27% |
90% |
1013 |
3038 |
450 |
150 |
66,67% |
96,67% |
95% |
1069 |
3206 |
225 |
79 |
64,89% |
98,24% |
Table 8.3.6.3.a
The net throughput, in this context, is the sum of throughput in A, B and C.
A |
The area covered by a circle with 100 nm radius |
B |
The area covered by a circle with 200 nm radius minus the area of A. |
C |
The area covered by a circle with 400 nm radius minus the area of A and B. |
Table 8.3.6.3.b
The results are shown in the diagram below:
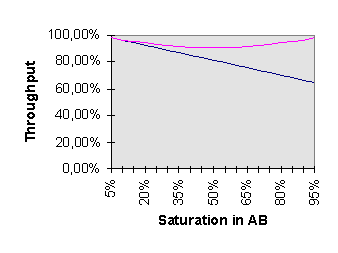
Diagram 8.3.6.3.a
The curved line shows the overall net throughput from areas A, B and C. The straight line shows the throughput from stations in area C.
8.4.6.4 Deriving Equations for Throughput
The presented equations contain constants which have been derived from the empirically collected data. The net throughput can be expressed as shown below:
TP(net) = 0.37*(Pop(AB)-0,50)+0,907 [Eq. C.2]
TP(net) |
Net throughput of all transmissions. |
0.37 |
Derived constant which smoothes out the curve. |
Pop(AB) |
Population inside the area covered by the 200 nm radius (1%-99%). |
0,50 |
At 50% (0,5) the lowest throughput is recorded (90,73%). |
0,907 |
The lowest net throughput. |
Table 8.3.6.4.a
The throughput of transmissions outside the 200 nm protected can be expressed as shown below:
TP(C) = 1 - 0,37 * Pop(AB) [Eq. C.3]
TP(C) |
Throughput of transmission outside the area protected by the 200 nm radius. |
0.37 |
Derived constant which gives the proper angle of the linear curve. |
Pop(AB) |
Population inside the area covered by the 200 nm radius (1%-99%). |
Table 8.3.6.4.b
8.4.6.5 Cell Radius
The test program keeps statistics about discrimination in relation to distance from the receiving station. The diagram below shows the result of this.
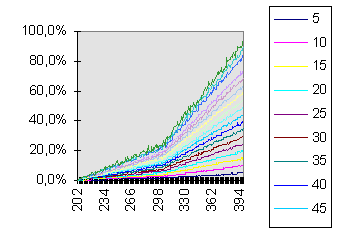
Diagram 8.3.6.5.a
Each curve in diagram 8.3.6.5.a represents a certain population within area A and B. The probability of discrimination is increasing with an increase in distance and an increase in population.
At 300 nm, the angle of the curve is increased by a factor of 3. The reason for this is that between 200 and 300 nm discrimination is a result of stations within area A conflicting with stations in C. B and C are in harmony. Between 301 and 400 nm both A and B may conflict with C. The area of B is 3 times larger than A, thus the factor of 3.
The probability of discrimination between 201 nm and 300 nm can be expressed as:
P(201-300) = 0,0025*Pop(AB)*(D-200) [Eq. C.4]
0,0025 |
The constant, which gives the curve angle in Diagram 8.3.6.5.a between 201 and 300 nm. |
D |
The distance, between the transmitter and the receiver, where the probability shall be calculated (200 < D < 300) nm. |
Table 8.3.6.5.a
The probability of discrimination between 301 and 400 nm can be expressed as:
P(301-400) = 0,0075*Pop(AB)*(D-300)+
0,25*Pop(AB) [Eq. C.5]
0,0075 |
The constant which gives the curve angle in Diagram 8.3.6.5.a between 301 and 400 nm. |
D |
The distance, between the transmitter and the receiver, where the probability shall be calculated (300 < D < 401 nm). |
0,25*Pop(AB) |
The probability of discrimination at 300 nm. |
Table 8.3.6.5.b
In order to study the dynamics of the cell radius, a minimum acceptable throughput must be established. Diagram 8.3.6.5.b shows curves for acceptable throughput ranging from 50% to 90%.
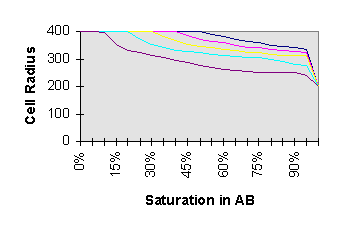
Diagram 8.3.6.5.b
The Y-axis shows the resulting cell radius and the X-axis shows the population within A and B. The table below lists the values used to derive diagram 8.3.6.5.b.
Pop(AB) |
R(50%) |
R(60%) |
R(70%) |
R(80%) |
R(90%) |
0% |
400 |
400 |
400 |
400 |
400 |
5% |
400 |
400 |
400 |
400 |
400 |
10% |
400 |
400 |
400 |
400 |
397 |
15% |
400 |
400 |
400 |
400 |
356 |
20% |
400 |
400 |
400 |
399 |
333 |
25% |
400 |
400 |
400 |
373 |
321 |
30% |
400 |
400 |
399 |
356 |
312 |
35% |
400 |
400 |
382 |
343 |
306 |
40% |
400 |
399 |
366 |
334 |
296 |
45% |
400 |
386 |
356 |
327 |
286 |
50% |
399 |
374 |
347 |
323 |
279 |
55% |
389 |
364 |
342 |
316 |
269 |
60% |
380 |
357 |
336 |
313 |
262 |
65% |
371 |
350 |
330 |
310 |
261 |
70% |
364 |
343 |
325 |
306 |
255 |
75% |
358 |
340 |
322 |
304 |
252 |
80% |
352 |
335 |
319 |
299 |
248 |
85% |
346 |
330 |
315 |
292 |
248 |
90% |
343 |
328 |
315 |
282 |
248 |
95% |
336 |
323 |
312 |
279 |
243 |
100% |
200 |
200 |
200 |
200 |
200 |
Table 8.3.6.5.c
8.4.7 Comments
The 200 nm guard distance is not an absolute limit to how far apart a transmitter and receiver can be. In this scenario, if all transmissions would have been inside 200 nm, the net throughput would have been 100%. Likewise, if all transmissions would have been outside the 200 nm radius, the throughput would have been 100%. This is not realistic. The scenario assumes that all transmissions are STDMA organized and within VHF link budget, which is quite unlikely in reality. However, it does show some important points:
Garbling will never occur as a result of propagation time only.
The net throughput, with respect to propagation, will always be above 90,7%.
The throughput of transmissions outside the protected distance is gracefully reduced as the traffic density increases closer to the receiving station.
In reality it is the difference in power levels which determines the outcome of conflicting transmissions. Distance between the stations affect the received power but, antenna installation is also an important factor.
The ramp-up time (i e the time it takes for the transmitter to produce nominal output power) is assumed to be 832 us. During this time the channel is idle (i e data is not output). If two transmissions are interfering due to propagation, the system provides additional tolerance. Assume that a transmission crosses a slot boundary. The next transmission starts off by ramping up the transmit power. Only when the power reaches ½ of the power from the transmission in the previous slot, that transmission is garbled. This would further improve the results of this analysis.
8.5
Time synchronization analyses focus on the different sources of synchronization to the TDMA data link when the primary synchronization source is lost. The primary source of synchronization is generally required to have an accuracy of 400 nanoseconds [ICAO AMCP] in aviation applications. This source can be provided by the 1PPS pulse generated by a GNSS receiver.
8.6.1 Basic Assumptions
The assumptions listed below are valid for every analysis in this appendix.
8.6.1.1 General Parameters
Parameter |
Value |
Comment |
GNSS update rate |
1 sec |
This is the update rate at which a GNSS receiver supplies the STDMA transponder with position information. The transponder will output the most recently received GNSS position when it transmits on the TDMA link. |
Low Horizontal Accuracy |
100 m |
The horizontal accuracy in position when differential corrections are unavailable or, when a backup system is used as a position source. |
High Horizontal Accuracy |
2 m |
The horizontal accuracy in position when differential corrections are available or, when a position is output by a base station. |
Low Vertical Accuracy |
200 m |
The vertical accuracy in position when differential corrections are unavailable or, when a backup system is used as a position source. |
High vertical Accuracy |
5 m |
The vertical accuracy in position when differential corrections are available or, when a position is output by a base station. |
Aircraft Direction |
Head On |
The aircraft direction is always directly towards or away from the source used for synchronization (worst case). |
Inaccuracy in arrival time measurement |
5 us |
The inaccuracy when a transponder times the start of a data bit. This value is affected by the frequency and is conservative with respect to the megahertz frequency band (Draft SARPS [ICAO AMCP] specify 1 us). |
Transmitter start jitter |
5 us |
The inaccuracy in the transponder transmit circuit. |
Backup System |
Yes |
It is assumed that each station is equipped with a backup system which is able to derive position information with the accuracy of the low horizontal and vertical accuracy. Examples are RNAV, Inertia system, Loran a s o. |
Primary time source stability |
1 us |
The accuracy of the primary time source. Most GNSS receivers are within 400 ns. |
Speed of light |
300 m/us |
meters per microsecond. |
Slots |
4500 |
There are 4500 slots per channel and superframe. (one superframe = 1 min). |
Pilot reaction time |
1 min |
The pilot shall have 1 (one) minute to discover a potential traffic conflict and to react on it. |
Table 8.4.1.1.a
8.6.1.2 Environment Parameters
Parameter |
Airport |
Terminal |
En route |
Aircraft Speed Over Ground (SOG) |
250 km/h |
450 km/h |
900 km/h |
Report Rate |
60 times/min |
12 times/min |
6 times/min |
Table 8.4.1.2.a
The report rate in the airport environment is a truly worst case. In reality most aircraft are either stationary or moving in non-critical areas of the airport. As a result, the average report rate can be a lot less than 60 times per minute.
8.6.2 Analysis 1: Loss of GNSS Receiver
8.6.2.1 Objective
The objective of this analysis is to:
…determine the effects of an isolated station losing its primary time source due to loss of GNSS receiver.
8.6.2.1.1 Scenario
A station loses its internal GNSS and thus also its primary time source. The failure is local to that station and there are other stations (mobiles and base stations) in the area of reception. The station reverts to its backup source for positioning, but must derive a new source of time synchronization to the TDMA data link.
8.6.2.2 Expected Results
The analysis shall show whether loss of primary time synchronization affects the throughput on the TDMA data link, both with respect to own reception and with respect to disturbances to other stations.
8.6.2.3 Assumptions
TDMA status |
There are other stations transmitting on the TDMA data link. These stations are synchronized to a primary time source giving the appropriate accuracy. |
Differential Corrections |
Unavailable for mobile stations. |
Table 8.4.2.3.a
8.6.2.4 Method
This is a desktop analysis based on the basic assumptions (section 8.4.1) and the assumptions from table 8.4.2.3.a.
The criteria for maintaining slot integrity is first analyzed. The timing error is then calculated. These results are finally compared in order to conclude if there are any conflicts due to the less accurate timing source.
8.6.2.5 Results
8.6.2.5.1 Slot Integrity
8.6.2.5.1.1 Worst Case Scenario
In the worst case scenario the receiving station is separated with the transmitting station by 200 nm (the guard distance). This eats up the buffer allocated for guard distance. At the same time the transmitting station, which is poorly synchronized, produces a transmit jitter (G) which is equivalent to the sum of all timing errors.
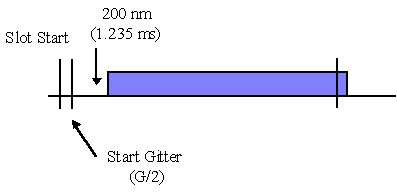 Figure 8.4.2.5.1.1.a
The start jitter results in a transmission starting either prior to, or after nominal slot start. It will be centered around the nominal slot start with +/- G/2.
8.6.2.5.2 Synchronization to a Base Station
The base station uses the high position accuracy and will thus gives the smallest error in distance measurement.
8.6.2.5.2.1 Deriving Distance Error
When a station attempts to synchronize to transmissions from another stations it will try to compensate for the distance between itself and the transmitting station. A timing error is introduced as a result in the inaccuracies in position information. The figure below illustrates this:
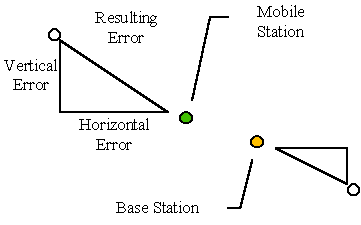 Figure
8.4.2.5.2.1.a
The worst case distance error between the mobile and a base station can be calculated as shown below:
![]()
8.6.2.5.2.2 Deriving Position Error
The internal position source is updated once every second (see general parameters). In the worst case scenario, the synchronization calculations are performed just before a new position is derived. The position is then 1 second old and the station has traveled a distance based on its speed over ground (SOG). The position error can be calculated using the equation below:
![]()
8.6.2.5.2.3 Adding the Errors
Table 8.4.2.5.2.3.a below shows the timing errors common to every aircraft environment (airport, terminal, en route).
Inaccuracy in arrival time measurement |
5 us |
Transmitter start jitter |
5 us |
Primary time source stability |
1 us |
Distance error |
229 m / 300 us = 0.76 us |
Sum |
11.76 us |
Table 8.4.2.5.2.3.a
Table 8.4.2.5.2.3.b below shows the accumulated timing error for the three different environments:
Value |
Airport |
Terminal |
En route |
Common error |
11.76 us |
11.76 us |
11.76 us |
Position error |
0.23 us |
0.42 us |
0.83 us |
Sum |
11.99 us |
12.18 us |
12.59 us |
Table 8.4.2.5.2.3.b
Table 8.4.2.5.2.3.b shows that the timing error is less than 13 us for all environments. This jitter affects the buffer allocated to guard time. 13 us is equivalent to 3.9 km (13*300/1000 km). The guard distance is thus reduced by 3.9 km or approximately 1%.
8.6.2.5.2.4 Comments
The degradation in performance, due to loss of primary synchronization, only affects the radius protected by guard time. In the analysis this degradation is 1% or a reduction from 370 km to 366 km radius. Stations in this region will only be in conflict with other stations on the same region. The throughput within 366 km is intact.
A station should calculate an average time based on several transmissions. This will smoothen the timing jitter and not simply add the timing error to the own transmission.
8.6.2.5.3 Synchronization to a Mobile Station
The mobile station uses the low position accuracy (in accordance with assumptions) and will thus give higher error in distance measurement than the base station case.
8.6.2.5.3.1 Deriving Distance Error
Distance error is derived in the same manner as in section 8.4.2.5.2.1 but the equation looks like below:
![]()
8.6.2.5.3.2 Position Error
In the worst case scenario, both stations are moving away from each other with a relative speed of 2*SOG. If it also is assumed that the transmitted position is 1 second old, the resulting equation looks like below:
![]()
8.6.2.6 Adding the Errors
The table below shows the timing errors common to every aircraft environment (airport, terminal, en route).
Inaccuracy in arrival time measurement |
5 us |
Transmitter start jitter |
5 us |
Primary time source stability |
1 us |
Distance error |
447 m / 300 us = 1.5 us |
Sum |
12.5 us |
Table 8.4.2.6.a
Table 8.4.2.6.b below shows the accumulated timing error for the three different environments:
Value |
Airport |
Terminal |
En route |
Common error |
12.50 us |
12.50 us |
12.50 us |
Position error |
0.46 us |
0.84 us |
1.66 us |
Sum |
12.96 us |
13.34 us |
14.16 us |
Table 8.4.2.6.b
Table 8.4.2.6.b shows that the timing error is less than 15 us for all environments. This is equivalent to 4.5 km, which still is approximately 1% of the distance allocated to guard time.
8.6.2.7 Comments
The degradation in performance, due to loss of primary synchronization, only affects the radius protected by guard time. In the analysis this degradation is 1% or a reduction from 370 km to 366 km radius. Stations in this region will only be in conflict with other stations on the same region. The throughput within 366 km is intact.
8.6.3 Analysis 2: Floating Network
A floating network exists when participants on the data link have lost their primary time source and must adopt to some sort of fallback mode for time synchronization.
8.6.3.1 Objective
The objective of this analysis is to:
…determine the effects when all participating stations lose their primary time source.
8.6.3.1.1 Scenario
The GNSS system fails (maybe it is shut down by the operator) and all stations are suddenly without primary time source. All stations reverts to their backup sources for positioning. The only source left for time synchronization is the transmission from other un-synchronized stations, or possibly base stations with a backup system for time synchronization. The TDMA data link becomes a floating network of stations continuously attempting to synchronize to each other.
8.6.3.2 Expected Results
The analysis shall show whether loss of primary time synchronization affects the throughput on TDMA data link, both with respect to own reception and with respect to disturbances to other stations.
8.6.3.3 Assumptions
TDMA status |
All participating stations have lost the primary time source. |
Differential Corrections |
Unavailable for all stations. |
Base stations |
Base stations are equipped with a backup source for timing (such as an atomic clock) with equal or better accuracy than the primary time source. |
Average Transmission Start |
Each received transmission is tagged with a time stamp. The time stamp is corrected for the distance and then added to an accumulator. The accumulator maintains the last 100 time stamps and provides an average value continuously. |
Own transmissions |
The time stamp for own transmission is also added to the time stamp accumulator. |
Table 8.4.3.3.a
8.6.3.4 Method
This is a desktop analysis, combined with simulations in C/C++, based on the basic assumptions (section 8.4.1) and the assumptions from table 8.4.3.3.a.
The criteria for maintaining slot integrity is first analyzed. The timing error is then calculated. These results are finally compared in order to conclude if there are any conflicts due to the less accurate timing source.
8.6.3.5 Results
8.6.3.5.1 Synchronizing to Base Stations
As stated in the assumptions, base stations are equipped with a backup source for time synchronization. This source is equal to, or better than the timing provided by the GNSS system (the 1PPS pulse). Mobile stations will synchronize to transmissions from base stations, if they can be received. Thus, the scenario is identical to that described in section 8.4.3.5.1 and the timing errors are the same.
8.6.3.5.2 Degradation Due to Total Loss of Time Reference
When a population of mobile stations are unable to receive transmissions from base stations (such as over an ocean) all sources of time are lost. This is a true floating network situation and will be examined in the following sections.
8.6.3.5.2.1 Initial Loss of Time Source
If a station has been fully synchronized to the primary time source and then suddenly loses it, it will maintain a very accurate synchronization for quite some time. A design which drifts approximately 3 us per minute is realistic to achieve [GP&C/S 2]. If a station maintains a lost sync state for an extended period of time, the cell radius will gracefully be reduced. Assuming, in worst case, that transmissions in adjacent slots drift in opposite directions, the cell radius can be described as shown in equation D.5 below:
Cell Radius in nm = (1248 - Time*6) * 300) / 1852 [Eq. D.5]
1248 |
The guard time in each slot (1248 us). |
Time |
The time from loss of primary time source, in minutes. |
6 |
The accumulated drift of two stations drifting opposite directions in time (2*3 us). This is a worst case scenario. |
300 |
The speed of light in meters per us. |
1852 |
The length, in meters, of one nautical mile. |
Table 8.4.3.5.2.a
If it is acceptable that the cell radius shrinks, the system can be allowed to drift for an extended period of time. The limit to the drift is dependent on the relative speed between mobile stations. In the worst case scenario, two stations move directly toward each other and their relative speed is the sum of their individual speeds. In the basic assumptions (section 8.4.1) the pilot reaction time is set to one minute. With this value, and the speeds for different aviation environments, table 8.4.3.5.2.b is derived.
Environment |
Speed |
Distance (1 minute) |
En route |
485 knots |
16.2 nm |
Terminal |
243 knots |
8.1 nm |
Airport |
135 knots |
4.5 nm |
Table 8.4.3.5.2.b
The distance in table 8.4.3.5.2.b equals the accumulated decrease in distance between 2 aircraft traveling on collision course for one minute. The results from table 8.4.3.5.2.b can then be used to compare results from Equation D.5 shown in table 8.4.3.5.2.c below:
Time (minutes) |
Radius (nm) |
0 |
206 |
10 |
196 |
20 |
186 |
30 |
176 |
40 |
167 |
50 |
157 |
60 |
147 |
70 |
138 |
80 |
128 |
90 |
118 |
100 |
108 |
110 |
99 |
120 |
89 |
130 |
79 |
140 |
69 |
150 |
60 |
160 |
50 |
170 |
40 |
180 |
31 |
190 |
21 |
200 |
11 |
210 |
1 |
Table 8.4.3.5.2.c
Table 8.4.3.5.2.c shows that the system can be allowed to remain in the lost sync state for over 3 hours (in all three types of airspace) before the cell radius is too short. This statement is based on the assumption that the TDMA data link traffic is saturated (all time slots are occupied). If the link traffic is low, the transmission jitter means less since a transmission can be allowed to drift into an adjacent slot which is unused. The conclusion is that table 8.4.3.5.2.c reflects the worst case scenario of a saturated link.
8.6.3.5.2.2 Maintaining Synchronization
Each station knows its nominal start time. The nominal start time is the time, corrected for distance, when the first bit of a transmission should be received in a slot.
The stations continuously calculate an average start time based on the latest received transmissions. The average time is compared to the nominal start time and when the difference between the calculated average value differs by a certain amount (maybe 21 us) the own timing is readjusted. The procedure is identical to the situation described in section 8.4.2.5.3.
8.6.3.5.2.3 Merging Populations
A floating network can maintain synchronization with a minimum loss of performance as long as all stations float together. This harmonic situation can be disturbed if two previously separated populations begin to merge as illustrated in figure 8.4.3.5.2.3.a below:
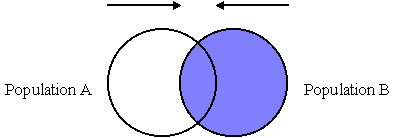
Figure 8.4.3.2.5.3.a
It must be assumed that the populations have been floating independently of each other and therefore may have drastically different transmission starts. Two questions must be answered:
Will the system become unbalanced and therefore crash?
If the answer to question 1 is no, how is the throughput affected?
8.6.3.5.2.3.1 Unbalanced System
Question number 1 addresses the situation when the participating station calculate average start times and readjusts their own time based on this. If a population of stations are injected into a stable system and these stations have totally different timing, how is the system then affected? Will it regain balance and how long does it take?
Diagram 8.4.3.52.3.1.a shows an example where 100 transmissions are spread within one slot (0-13.33 ms), and how an average start time is continuously calculated and used. The average value is based on the 100 most recently received transmissions. The example assumes that the stations initially do not receive any other transmissions. They then simultaneously start to receive and derive an average transmission time.
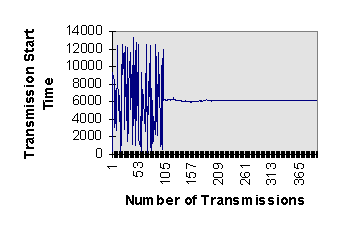
Diagram 8.4.3.5.2.3.1.a
The first 100 transmissions are randomly assigned a transmission start between 0 and 13.33 ms. From transmission 101, average transmission start is calculated. Approximately 150 transmissions (transmission number 250) after starting to calculate average values, the transmissions are again in harmony. This of course assumes that all transmissions were received and included in the calculation. Nevertheless, the system strives to stabilize rather than accelerate the disturbance.
8.6.3.5.2.3.2 Throughput Issues
Throughput is analyzed by simulation in C/C++. A virtual image of a cell with 200 nm radius is created (the cell holds population A). The TDMA data link is saturated. Transmissions from a different population (population B) are then merged with the original cell and the effects are analyzed. The transmissions from population B are synchronized within that cell. The net throughput is measured from the center of the cell which contains population A.
The factors affecting the throughput are:
Transmission start time. If the transmission start time overlaps the next adjacent slot, a conflict occurs.
Distance between conflicting stations. Garbling or discrimination occurs as a result of the transmit conflict. If the conflicting transmissions are close to each other they will both be garbled. If they are separated by a factor of 2, the farthest transmission is discriminated.
The transmission start time is selected as shown in table 8.4.3.5.2.3.2.a below:
Pop |
Start |
Comments |
A |
2080 us |
The time when the first bit of the start flag would normally be detected. Ramp up (16 bits) plus training sequence (24 bits). (24+16)*52 = 2080us. |
B |
13333 us |
End of slot in us. |
Table 8.4.3.5.2.3.2.a
The times in table 8.4.3.5.2.3.2.a are in reference to the station in the center of population A and corrected for propagation time.
The actual transmission time is corrected for distance before it is analyzed with respect to the receiving station.
Repeated simulations are performed with different merging times (i e the time it takes to merge the two cells). The results are listed in table 8.4.3.5.2.3.2.b below.
Merging time (min) |
Relative speed (km/h) |
Time to restore sync (seconds) | Lowest throughput |
Average throughput |
10 |
2220 |
56 |
78% |
95% |
20 |
1110 |
75 |
85% |
96% |
30 |
740 |
94 |
85% |
97% |
40 |
555 |
121 |
86% |
97% |
50 |
444 |
121 |
88% |
97% |
60 |
370 |
140 |
87% |
98% |
70 |
317 |
145 |
90% |
98% |
80 |
278 |
131 |
90% |
98% |
90 |
247 |
160 |
91% |
98% |
100 |
222 |
147 |
91% |
98% |
Table 8.4.3.5.2.3.2.b
Merging time |
The time it takes before the two populations have merged completely |
Relative speed |
The resulting relative speed between the populations (a function of the merging time). |
| Time to restore syncS | The time it takes to restore synchronization close to 100%. |
Lowest throughput |
The lowest average throughput calculated over 100 slots during the time to restore sync. |
Average throughput |
The average throughput calculated on all slots from the first reduction in throughput until the throughput is restored to its original value. |
Merging the cells faster results in synchronization to be restored faster but a larger reduction in throughput.
Merging the cells slower results in synchronization to be restored slower but a smaller reduction in throughput.
The average throughput is never below 95%.
8.6.3.6 Comments
The negative effects of losing the primary time source are minimized since the STDMA system contains a number of fallback modes. The fallback procedure can be summarized as this:
When a station loses its primary time source it will enter a lost sync state and slowly start to drift in time (approximately 3 us/min).
During the lost sync state it will listen for base stations and derive an average transmission start time based on the transmissions from base stations.
If it can not receive any base stations, it will listen for mobile stations which are synchronized to the primary time source.
If it can not receive any transmissions which are synchronized to the primary time source, the TDMA link is a floating network and all participating stations are continuously deriving average transmission start times.
The only time that the net throughput is affected due to poor time synchronization is when two independent populations merge. Even then the average throughput is 95% or better.
The scenario described in this section looks at two merging populations. If more populations begin to merge, it is likely that the synchronization becomes unbalanced. It is however, quite unlikely that all stations around the globe, are unable to receive transmissions from base stations. By using a refined priority scheme for synchronization, taking into consideration stations which are directly or indirectly in contact with bas stations, a balanced system is still easily achieved.
8.7
8.8 E - Organization
8.8.1 Introduction
The link organization analyses focus on the capability of the STDMA algorithm to maintain slot organization on the TDMA data link.
8.8.2 The VHF Cell
Each participating station operates in its own unique VHF cell. The cell extends horizontally and vertically.

Figure 8.5.2.a
The cell shape can be approximated as a cylinder with the radius extending to the horizon or to the range given by link budget (see figure above). Theoretically, two stations will have identical VHF cells if they are positioned on top of each other. This is generally not the case. Rather, the stations will have partially overlapping VHF cells. As a consequence, the communication, on the TDMA data link, will be more or less organized, depending on how much the cells are overlapping.
8.8.3 Automatic Slot Reuse
A consequence, when a population of stations is not fully STDMA organized, is that two or more stations may attempt to use the same time slot for transmission. This is called automatic slot reuse. The stations, involved in automatic slot reuse, are unaware of the fact that they are using the same time slot. They have determined the time slot to be free and available for use.
8.8.4 Intentional Slot Reuse
If a station experiences that the TDMA data link is used to its maximum capacity, it might have to resort to using time slots which are known to be reserved by other stations. This is called intentional slot reuse. When a station applies intentional slot reuse it will generally reuse time slots reserved by stations which are the farthest distance from the own position. The decision to reuse such a time slot, is based on transmitted position information and knowledge of own position.
8.8.5 Garble and Discrimination
Intentional and automatic slot reuse can produce one, of two results, at a receiving station:
Garble, where none, of a number of transmissions in a time slot, was received correctly at a receiver.
Discrimination, where one, of a number of transmissions in a time slot, was received successfully at a receiver.
Discrimination will generally occur when one transmission, results in higher received power than others. This happens when that transmitter is closer to the receiver or when it uses more output power than others. Atmospheric effects can also have an influence. This analysis assumes that the output power is equal for all stations and that the atmospheric effects can be neglected.
8.8.6 Basic Assumptions
Parameter |
Value |
Comments |
Modulation |
GMSK/FM | - |
Distance ratio |
½ |
Equivalent to ¼ output power ratio (6 dB). |
Population |
Evenly distributed | - |
Movements |
Randomly | Each individual station is moving independently of other stations. |
Transmit Power |
Equal | The transmit power is equal for all participating stations in a population |
Table 8.5.6.a
8.8.7 Analysis 1: Remote Area
This analysis looks at an area with none or low data link traffic.
8.8.7.1 Objective
The objective of this analysis is to:
…determine the ability of the STDMA algorithm to resolve transmission conflicts in low traffic situations.
The analysis examines how long it takes before a station discovers another, and the probability of continuous transmission conflicts.
8.8.7.1.1 Scenario
Two stations are approaching head on over water or in the air at a speed of (v). Their cells have equal size with a radius (r), restricted by either link budget or the horizon. When they come within VHF reach of one another they are un-organized and may be using the same slot for transmission and thus unable to see each other.

Figure 8.5.7.1.1.a
Depending on the STDMA update rate (r), they will also have a possibility of further approaching each other before any station transmits for the first time after coming within RF reach of each other.
8.8.7.2 Expected Results
This analysis shall result in probability values for transmission conflicts in the given scenario. It shall also describe how the VHF cell is affected by the movements of the two stations.
8.8.7.3 Assumptions
Parameter |
Value |
Comments |
Speed |
v | The speed at which A and B are approaching each other head on. The total speed is 2*v. |
Update Rate |
u | The update rate at which A and B are broadcasting their positions on the data link (reports/minute). Assumed to be the same for A and B. |
Cell Radius |
r | The VHF cell radius. Assumed to be the same for A and B. |
Slots |
SL | Specifies how many slots the data link uses per minute (2250 - 9000). |
Table 8.5.7.3.a
8.8.7.4 Method
This is a theoretical analysis based on the assumptions listed in this appendix and results from other analyses in this thesis. The results are applied in examples for illustration purposes.
8.8.7.5 Results
8.8.7.5.1 Probability of Allocating the Same Slots
The STDMA algorithm attempts to spread transmissions evenly over time using a Nominal slot Increment - NI. At random intervals the chosen slots are changed to new slots which are determined by the algorithm, to be available. The jump to a new slot is always within an interval which is 0.2*NI (also called Selection Interval - SI). The selection interval (SI) is a set of consecutive slots.
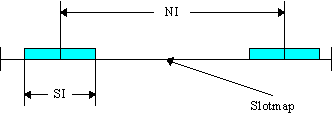
Figure 8.5.7.5.1.a
For a conflict to occur, when only two stations are involved, the SI of each station must overlap partly or in whole. In the worst case scenario, they overlap completely. The probability of this is:
P(Overlap) = 1 / (SL-SI) [Eq. E.1]
In addition to this, the two stations must have selected the same slot within the SI. The probability of this is:
P(Same Slot) = 1/SI [Eq. E.2]
The Nominal Increment - NI is given by:
NI = SL / u [Eq. E.3]
The Selection Interval (SI) is given by:
SI = 0.2NI = 0.2SL / u [Eq. E.4]
Combining Eq. E.2 and E.4 results in:
P(Same Slot) = u / 0.2SL [Eq. E.5]
The probability of a conflict in the first slot which could be received is:
P(Overlap) * P(SameSlot) [Eq. E.6]
The probability of n successive conflicts is then:

Further simplification results in equation E.8 below:
P(n conflicts) = 1 / [( SL-SI )( SI )n ] [ Eq. E.8]
Probability of detection within n transmissions is:
P(Detection) = 1 - E.8 [Eq. E.9]
8.8.7.5.1.1 Example
An example will illustrate the probability of conflicts in n successive slots, based on the following assumptions:
Parameter |
Value |
Comments |
SL |
2250 | Slots per minute. |
u |
12 | Number of reports per minute. |
Table 8.5.7.5.1.1.a
The results are listed in the table below:
n |
P( n successive conflicts ) [Eq. E.8] |
1 |
1.21 * 10-5 |
2 |
3.21 * 10-7 |
3 |
8.57 * 10-9 |
4 |
2.29 * 10-10 |
Table 8.5.7.5.1.1.b
The example above shows that it is extremely improbable that the stations have not received at least one transmission within 3 attempts.
Another approach, to calculating the probability, is described by professor Lars Zetterberg, in the addendum to this appendix (section 8.5.9). Using probability expression Ad.8, yields the results below:
n |
P( n successive conflicts ) [Eq. Ad.8] |
1 |
3.39 * 10-4 |
2 |
8.04 * 10-6 |
3 |
2.01 * 10-7 |
4 |
5.14 * 10-9 |
Table 8.5.7.5.1.1.c
8.8.7.5.2 Expected Time to Detection
In the worst case both A and B have just transmitted prior to coming into VHF reach of each other. It will then take an additional 60 / u seconds until next transmission. If they are traveling with a speed of v, the relative distance (d) traveled is expressed as:
d = 2 * v * (60 / u ) * n [Eq. E.10]
Speed (v) is expressed as units per second (for example m/s).
As a result the VHF cell radius is compressed with d ahead of the station.
8.8.7.5.2.1 Example
This example illustrates how the radius is compressed based on station speed and the input parameters listed below:
Parameter |
Value |
Comments |
n |
3 | It is extremely improbable that the stations have not received each other at least once after 3 attempts. |
u |
12 | Number of reports per minute. |
Table 8.5.7.5.2.1.a
Since the stations transmitted just prior to reaching VHF coverage, it will take an additional 5 seconds (60 seconds / 12 reports per minute) prior to next transmission. Thereafter, 3 more transmissions are executed.
In the example above, it can be assumed that the stations have received at least one successful transmission within 15 seconds.
Two stations, approaching each other will travel some distance, based on their speeds, during these 15 seconds. The table below lists distances based on speed.
v |
d |
900 km/h |
7500 m |
500 km/h |
4167 m |
100 km/h |
831 m |
50 km/h |
417 m |
25 km/h |
207 m |
Table 8.5.7.5.2.1.b
8.8.7.5.2.2 VHF Cell Shape
The example above shows that, even though two stations are within VHF coverage, the actual detection may be delayed somewhat. This can be visualized by a modified VHF cell. At high speeds, the cell is compressed in front of the station by a distance (d).

Figure 8.5.7.5.2.2.a
8.8.7.5.3 Conflict Resolution
If conflicts do occur in a slot, it can be determined how long it takes before they are resolved. Each slot is assigned a time-out which can be anywhere between 0 and 8 minutes. As a consequence slots are changed, and conflicts resolved, every 4 minutes ( (0 + 8) / 2 ) on average.
8.8.7.6 Comments
In situations with none or little data link communication, the probability of a transmission conflict is very small. Even if one should occur, it affects only one out of all transmissions during a minute. The conflict is, on average, resolved after 4 minutes.
8.8.8 Analysis 2: High Data Link Load
The data link is saturated when the required number of slots is equal to, or higher than the available. Under these circumstances more slots may generally be needed than currently available.
The result is automatic or intentional slot reuse, which may result in garble or discrimination at a receiving station.
8.8.8.1 Objective
The objective of this analysis is to:
…determine the net throughput, at a station, which is receiving transmissions from other stations, which are partially organized to the cell of the receiving station.
8.8.8.1.1 Scenario
A station is situated in the center of a population of STDMA stations. It is receiving transmissions from stations at a radius (r), limited by the horizon or link budget, but less than 200 nm (the guard distance). Since each station, in the population, operates in its own VHF cell, some of the transmissions are un-organized with respect to the receiving station. As the number of stations, in the area, increases, more slot reuse is anticipated to occur.
8.8.8.2 Expected Results
The analysis shall show how the throughput varies with distance between receiving station and transmitting station. It shall also show how TDMA data link saturation affects the throughput. The results shall be described mathematically and in diagrams.
8.8.8.3 Method
This is a theoretical analysis and a simulation in C++, to examine the factors affecting capacity and throughput.
8.8.8.4 Results
8.8.8.4.1 Organized Transmissions
Since each station operates in its own unique cell, it can only be 100% organized with a receiving station when it is on top of it. The figure below shows two stations separated by a distance (d). Each cell has a radius (r). The length of the radius depends on line of sight or link budget. When the transmitting station and the receiving station initially come in contact, the distance (d) and radius (r) are equal. The shaded area is common to both stations. It can be assumed that they are both organized to other stations residing in this common area.
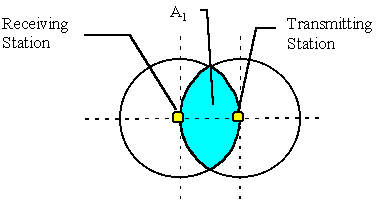
Figure 8.5.8.4.1.a
From the point where the distance (d) equals 2r, there will always be some degree of organization. They will not be 100% organized until d equals zero (i e the stations are on top of each other).
8.8.8.4.2 Data Link Saturation
Anytime that stations have a degree of organization of less than 100%, there is a probability of transmission conflicts. However, this probability is reduced with a reduction in required TDMA link capacity. If the required TDMA link capacity is 100%, or more (i e the required number of slots equal the maximum available capacity), the link is saturated.
8.8.8.4.2.1 Saturation and Slot Reuse
When stations select new slots for transmission, they do so by viewing their own image of the VHF cell. Assuming that two stations (A and B) are transmitting but unable to receive each other since they are outside of their respective VHF coverage. A third station (C) is within VHF coverage and thus receiving both stations. Although A and B are applying the STDMA algorithm in their slot allocation, it appears to C that they are randomly selecting slots. This may result in automatic slot reuse. Station A and B are unaware of each other and thus unorganized with each other.
A scenario, where all stations transmitted in randomly selected slots, was simulated using a C++ program. The TDMA link was first empty and then successively loaded up to maximum capacity. The simulation then continued with an overloaded system (i e the required capacity exceeded the available). Each load on the TDMA link was tested 1000 times in order to get an average value of number of reused slots. The results are displayed in table 8.5.8.4.2.1.a and diagram 8.5.8.4.2.1.a below. When the TDMA link is saturated (required capacity is 100%) slot reuse affects 63% of available slots.
This corresponds to a slotted ALOHA system [G. Maral et al] which gives approximately 37% throughput. The slotted ALOHA is a TDMA system applying a random selection algorithm.
Required Capacity (%) |
Slot Reuse (%) |
0 |
0 |
10 |
10 |
20 |
18 |
30 |
26 |
40 |
33 |
50 |
39 |
60 |
45 |
70 |
50 |
80 |
55 |
90 |
59 |
100 |
63 |
110 |
67 |
120 |
70 |
130 |
73 |
140 |
75 |
150 |
78 |
200 |
86 |
300 |
95 |
400 |
98 |
500 |
99 |
Table 8.5.8.4.2.1.a
As mentioned earlier, the slot reuse may result in garble or discrimination.
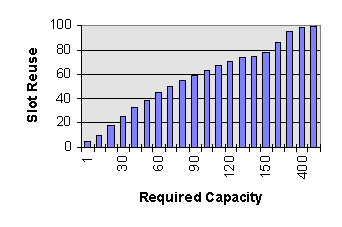
Diagram 8.5.8.4.2.1.a
8.8.8.4.2.2 Selection of Slots
All stations, in a population, have some degree of organization. A receiving station (R) will experience that a transmitting (T) station will avoid using slots occupied within the zone where the VHF cells of R and T overlap. T will instead select from other stations within its own VHF cell. When the TDMA link is saturated, these selections will always be in conflict with other stations within the VHF cell of R and thus result in garble or discrimination.
8.8.8.4.3 Garbling and Discrimination
8.8.8.4.3.1 The Aloha Zone
Slot reuse may result in discrimination or garbling. A study of when garbling occurs, shows that for distances (d) between r and r/2 (between transmitter and receiver) garbling is the result in every case of slot reuse. This is a result of the GMSK co-channel interference (CCI) feature. The difference in distance between two stations must be a factor of 2 or higher, in order to produce a big enough difference in received power. This does not occur until the interfering stations are located at r and r/2 from the receiver, thus fulfilling the distance ratio of 2 to 1 (see appendix B).
Figure 8.5.8.4.3.1.a
The result is that table 8.5.8.4.2.1.a shall be applied when deriving net throughput for transmissions between r and r/2 from the receiver.
To a receiver (Rx in the figure above), transmitters in the region r to r/2 (for example Tx 1 and Tx 2), will appear to select slots randomly. Therefore, this region is called the Aloha Zone.
The net throughput, in the Aloha Zone, is equal to:
TP(r ³ d > r/2) = 1 - Slot Reuse; [Eq. E.11]
Slot Reuse = Table 8.5.8.4.2.1.a
As an example, the throughput is 22% at a required capacity which is 150% of available (1-0.78).
It shall be emphasized that stations within the Aloha Zone are still received, but when slots are reused, it results in zero throughput (garble) for that particular transmission.
8.8.8.4.3.2 The Discrimination Zone
From r/2 to r/3 some of the slot reuse result in discrimination and thus allowing the transmission from the closer station to be received. This is illustrated below:
Figure 8.5.8.4.3.2.a
The area which may reduce the throughput is only the garbling area. This area is derived by approximation of the discrimination area (Ad). The discrimination area is expressed as:
Ad / A = ( 1 - 4k2 )2 * arccos( k/2 ); 0 £ k £ 1 [Eq. E.12]
The angle (k/2) is expressed in radians. At r/3 the discrimination area meet the organized area. The net throughput (TP) in the range r/2 to r/3 is expressed as:
TP(r/2 ³ d > r/3) = ((Ad + (1-E.11)*(A - Ad)) / A [Eq. E.13]
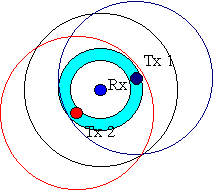
Figure 8.5.8.4.3.2.b
While in the region between r/2 and r/3, transmitting stations are able to receive each other and thus organized. They will, however, reuse slots from stations in the Aloha Zone. The region between r/2 and r/3 is called the discrimination zone.
8.8.8.4.3.3 The Protected Zone
At distances ranging between r/3 to 0, the organized area and the area of discrimination overlap and as a result all transmissions from stations within r/3 are received unless intentional slot reuse is used.
Figure 8.5.8.4.3.3.a
Automatic slot reuse is performed, by reusing slots from the Aloha Zone. Every reused slot results in discrimination. This allows all transmissions to be received in the region r/3 to 0. Thus, this region is called the Protected Zone.
8.8.8.4.4 Applying the Equations
The equations are applied with respect to distance (0 - r) and a required capacity between 0 and 200%.
Zone |
Equation |
| Protected | TP(net) = 1 |
| Discrimination | TP(net) = E.13 |
| Aloha | TP(net) = E.11 |
Table 8.5.8.4.4.a
The result is illustrated in diagram 8.5.8.4.4.a.
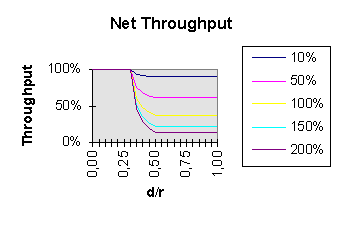
Diagram 8.5.8.4.4.a
Each line in the diagram illustrates a certain required capacity. The top most line shows 10% required capacity and the bottom line shows 200%. The diagram illustrates how the net throughput varies with distance between transmitting stations and a receiving station.
Table 8.5.8.4.4.b below illustrates the same results as in diagram 8.5.8.4.4.a above.
Required Capacity and Net Throughput |
|||||
Dist |
10% |
50% |
100% |
150% |
200% |
0,00 |
100% |
100% |
100% |
100% |
100% |
0,05 |
100% |
100% |
100% |
100% |
100% |
0,10 |
100% |
100% |
100% |
100% |
100% |
0,15 |
100% |
100% |
100% |
100% |
100% |
0,20 |
100% |
100% |
100% |
100% |
100% |
0,25 |
100% |
100% |
100% |
100% |
100% |
0,30 |
100% |
100% |
100% |
100% |
100% |
0,35 |
94% |
75% |
60% |
50% |
45% |
0,40 |
92% |
68% |
48% |
36% |
29% |
0,45 |
90% |
63% |
40% |
26% |
18% |
0,50 |
90% |
61% |
37% |
22% |
14% |
0,55 |
90% |
61% |
37% |
22% |
14% |
0,60 |
90% |
61% |
37% |
22% |
14% |
0,65 |
90% |
61% |
37% |
22% |
14% |
0,70 |
90% |
61% |
37% |
22% |
14% |
0,75 |
90% |
61% |
37% |
22% |
14% |
0,80 |
90% |
61% |
37% |
22% |
14% |
0,85 |
90% |
61% |
37% |
22% |
14% |
0,90 |
90% |
61% |
37% |
22% |
14% |
0,95 |
90% |
61% |
37% |
22% |
14% |
1,00 |
90% |
61% |
37% |
22% |
14% |
Table 8.5.8.4.4.b
8.8.8.4.5 Effects of Intentional Slot Reuse
All stations maintains an image of the TDMA data link. Slots are marked as free, reserved or available.
A slot is free if the receiving station detected only noise, with little or no carrier, in it.
A slot is reserved if the receiving station has received data (with correct checksum) indicating that the slot is occupied.
A slot is available if a receiving station detected a carrier, an aborted data burst or data with incorrect checksum.
For reasons of simplicity, it is assumed that stations select slots from free, as well as, available slots. Intentional slot reuse then only affects reserved slots. So, as long as there is a set of free or available slots to select from, only automatic slot reuse is needed.
Using this simplified reasoning, although the required capacity is over 100% of available, a receiving station will still receive garbled transmissions and thus use automatic slot reuse, since these slots are marked available.
Only slots in the protected zone will need to apply intentional slot reuse, since this is the only area in which garble does not occur on an overloaded data link.
8.8.8.4.5.1 Required Capacity
When a station determines that 100% of all slots are reserved, it will need to apply intentional slot reuse. Based on the previous assumptions, this will only occur in the protected zone and part of the discrimination zone. The size, of the these zones, is 1/4 of the whole VHF cell. As a consequence, intentional slot reuse will be applied only when the required capacity approaches 700% of available. At this load, the VHF cell boundary has since long shrunk to r/3.
8.8.8.4.5.2 Effects
As soon as stations begin to apply intentional slot reuse, garbled slots will again reappear. Since slots are now selected from stations within r/3, this radius becomes the outer perimeter and the new radius r. Since garbled slots reappear, stations will tend to return to automatic slot reuse. This can cause unwanted contention. In reality, intentional slot reuse is applied even though the link appears to be less than 100% reserved. Slots shall always be selected from a combination of free, available and reserved slots. The mix of these three categories may vary depending on the load.
8.8.8.5 Example
The example presented in this section extends the scenario as described below.
8.8.8.5.1 The Scenario
A base station is installed to monitor a port. It is positioned so that it covers an area of a half circle with the radius 2r.
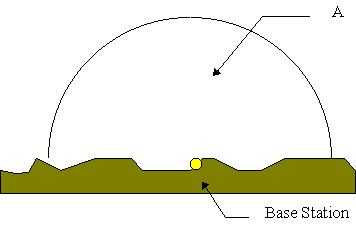
Figure 8.5.8.5.1.a
Within the area (A) there are 225 ships all transmitting position reports 10 times per minute thus allocating 100% of the data link (225 * 10 = 2250 slots).
Each ship has a VHF cell with a radius which is equal to r.
8.8.8.5.2 Experienced Load
Since the area covered by the base station (A) holds 225 ships with an average report rate of 10 times per minute, all slots in the superframe are ideally occupied (assuming one channel at 2250 slots per minute). The required capacity at the base station is then 100%. Each mobile has a cell which is more or less covered by A. The overlapping areas range between 1/8 to 1/2 of the mobile cell area. As a consequence the mobiles will experience a load between 12.5% (1/8) and 50% (1/2). They will happily select from, what they view, as free slots. As a result the base station will experience that the mobile stations use automatic slot reuse.
8.8.8.5.3 Net Throughput
Since the coverage area, of the base station, is larger than that of the mobile stations, the TDMA data link is only saturated at the base station.
The mobile stations experience at most 50% used capacity and will thus apply automatic slot reuse.
To model the net throughput, table 8.5.8.4.4.b can be applied with a required capacity of 100% (see table 8.5.8.4.4.b). The distance is from the base station to a transmitting mobile unit (1.0 = 2r).
Distance (0 to 2r) |
Net Throughput (percent) |
Net Througput (reports/minute) |
0,00 |
100% |
10 |
0,05 |
100% |
10 |
0,10 |
100% |
10 |
0,15 |
100% |
10 |
0,20 |
100% |
10 |
0,25 |
100% |
10 |
0,30 |
100% |
10 |
0,35 |
60% |
6 |
0,40 |
48% |
5 |
0,45 |
40% |
4 |
0,50 |
37% |
3-4 |
0,55 |
37% |
3-4 |
0,60 |
37% |
3-4 |
0,65 |
37% |
3-4 |
0,70 |
37% |
3-4 |
0,75 |
37% |
3-4 |
0,80 |
37% |
3-4 |
0,85 |
37% |
3-4 |
0,90 |
37% |
3-4 |
0,95 |
37% |
3-4 |
1,00 |
37% |
3-4 |
Table 8.5.8.5.3.a
The results from table 8.5.8.5.3.a are illustrated in the diagram below:
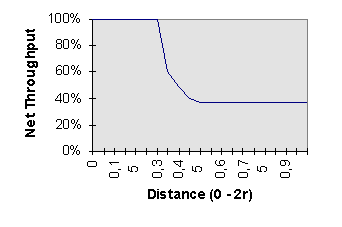
Diagram 8.5.8.5.3.a
8.8.8.5.4 Further Improvements
The throughput at the base station can be further improved by using a directional antenna and multiple receivers. The frequency will be multiplexed and a system redundancy is introduced.
8.8.9
8.8.10 Addendum
The Probability of
Allocating the Same Slot
An Extended Analysis
Lars H Zetterberg
It may happen that two stations will choose the same slot, if their selection intervals (SI) are overlapping, either completely or partially. In the main text, of Appendix E, the case with complete overlap is analyzed. The analysis is here extended to also cover partial overlap.
Assume that the two selection intervals-SI, overlap in M slots, and call this set M. Observe that this may occur in two ways, namely in the left, or right part of either SI when M < SI. With complete overlap, there is only one possibility. Let first one station have its selection interval (SI) located, and then randomly locate the SI of the other station. Any such event will have the probability:
P(overlap of size M) = 1/(SL-SI); [Eq. Ad.1]
One has taken into account that the midpoint of SI has only SL-SI possible locations (SL being the total number of slots in one minute).
Consider now the case where the overlap is M slots with M £ SI. The probability that the two stations search in a common set M is:
P(same set) = (M/SI)2; [Eq. Ad.2]
With M possibilities, the same slot will be chosen with probability 1/M, and hence the probability of conflict will be M/(SI)2. With 1 £ M £ (SI/2) and SI, even there will be two disjoint sets, each of length M, and hence the probabilities may be added:
P(same slot with overlap of size M) = 2M/(SI)2;
M £ (SI/2) [Eq. Ad.3]
With M = (SI/2) the probability becomes 1/SI. It may be argued that this expression holds also for M>(SI/2), since then the two M sets will cover the whole selection interval of the first station. One should then add probabilities of conflict in two disjoint sets of size M and SI-M respectively. We conclude:
P(same slot with overlap of size M) = 1/SI;
1/SI < M £ SI [Eq. Ad.3]
That this expression holds with complete overlap, is already observed in equation C.2.
During n successive transmissions, there is no change in the overlap situation, but independent trials within the SI will take place. This leads to a probability of selecting the same slot in every transmission, given that an overlap of size M has occurred:
(2M)n/(SI)2n; M£ SI/2; [Eq. Ad.5a]
P(same slot) =
1/(SI)n; SI/2<M£ SI; [Eq. Ad.5a]
In equation Ad.5a, M and n are known.
By multiplying these expressions by the event probability Ad.1, one gets the probability of conflict, given the overlap to be M with n transmissions. The total probability of conflict is achieved by summation of contributions for each M. It is then convenient to find a closed expression for the sum S Mn with M running from 1 to SI/2. It can be approximated by the integral of xn from x = 0 to SI/2. The result is:
S = (SI/2)(n+1)/(n+1); [Eq. Ad.6]
We may then write the probability in all of n successive transmissions:
P(conflict) = [(2nS)/(SI)2n + ½(SI)n-1]/(SL-SI); [Eq. Ad.7]
The expression can be simplified to become:
P(conflict) = C/[(SL-SI)(SI)n-1]; [Eq. Ad.8]
C = [(1/(n+1)) + 1]/2
This expression should be compared to the formula for complete overlap, as given by equation C.8:
P(conflict) = 1 / [( SL-SI )( SI )n ] [ Eq. Ad.9]
Taking SI = 37 and n = 1, the ratio between Ad.8 and Ad.9 becomes 28, which is a significant difference. The probability of conflict is still small when n = 2 or larger, which is an essential conclusion.
9 Acronyms
ADS-B |
Automatic Dependent Surveillance - Broadcast |
AIS |
Automatic Identification System |
AM |
Amplitude Modulation. |
AMCP |
Aeronautical Mobile Communications Panel. Sub-panel to ICAO. |
ATC |
Air Traffic Control |
CNS |
Communication Navigation and Surveillance. |
COG |
Course Over Ground. |
CS |
Carrier Sense. |
dB |
Decibels. |
DSC |
Digital Selective Calling. A maritime communication system. |
FM |
Frequency Modulation. |
GLONASS |
GLObal NAvigation Satellite System. A GNSS operated by Russia. |
GMSK |
Gaussian Minimum Shift Keying, a signal modulation method. |
GNSS |
Global Navigation Satellite System. A system, based on the known position of a number of satellites, used in order to continuously derive a position around the globe. |
GPS |
Global Positioning System. A GNSS operated by the USA. |
IALA |
International Association of Light house Authorities. |
ICAO |
International Civil Aviation Organization. International body which deals with standards and legislation. |
IMO |
International Maritime Organization. |
km |
Kilometer. |
MSL |
Mean Sea Level. |
nm |
Nautical mile. Equal to 1.852 meters. |
RSS |
Received Signal Strength. |
SARPS |
Standards And Recommended Practices |
SOG |
Speed Over Ground. |
STDMA |
Self-Organized Time Division Multiple Access. |
TDMA |
Time Division Multiple Access. |
VDL |
VHF Data Link. |
VHF |
Very High Frequency. Frequencies in the region 30-300 MHz [Ahlin et al]. |
VTS |
Vessel Traffic Service |
10 Vocabulary
Position Sensor |
A system which can determine its own position. GNSS receivers and LORAN receivers are a couple of examples. |
Carrier Sense |
A method of detecting that a data link is available by measuring the received signal strength (RSS). |
Required Capacity |
The total capacity required by all stations within a given area. Generally specified in number of slots per minute. |
Available Capacity |
The theoretically available capacity. Generally specified in number of slots per minute. |
Perceived Load |
The experienced data link load at a receiver, based on the assumption that the receiver only consider successfully received transmissions. |
11 References
| [G. Maral et al] | G. Maral, M. Bousquet. 1986, Satellite Communications Systems, John Wiley & Sons Ltd |
| [L. Ahlin et al] | L. Ahlin, J. Zander. 1990, Radiokommunikation - Tillämpad kommunikationsteori för digitala radiosystem, Royal Institute of Technology |
| [S. R. Jones] | S. R. Jones. 1994, Relative Capacities of Generic ADS Protocols, Air Traffic Control Quarterly, John Wiley & Sons Ltd |
| [RTCA 186] | RTCA Special Commitee 186. 1996, Minimum Aviation System Performance Standards: Automatic Dependent Surveillance Broadcast (ADS-B), Draft 3.0, RTCA |
| [V. Orlando et al] | Vincent A. Orlando, George H. Knittel, Robert E. Boisvert. 1994, GPS-Squitter: System Concept, Performance. And Development Program, The Lincoln Laboratory Journal, Vol 7, #2 |
| [LFV Card 1] | The Swedish Civil Aviation Administration - LFV. 1995, Cellular CNS Concept - Discrimination of Weaker Signals using STDMA VHF/GMSK, The Swedish Civil Aviation Administration |
| [L. Johnsson] | Larry Johnsson. 1996, Comparison of Capacity and Robustness for GMSK and D8PSK Modulation, Aeronautical Mobile Communications Panel - AMCP, Agenda Item 3, Jan 15-24, 1996 |
| [V. A. Orlando] | Vincent A. Orlando. 1996, A Critique of the SARPS and Guidance Material Proposed for the STDMA Approach for ADS-B, Massachusetts Institute of Technology, Lincoln Laboratory, 42PM-Squitter-0008 |
| [R. E. Boisvert] | Robert E. Boisvert. 1996, Issues Regarding the use of STDMA for ADS-B, Massachusetts Institute of Technology, Lincoln Laboratory, 42PM-Squitter-0009 |
| [J. M. Ferrara] | John M. Ferrara. 1989, Every Pilots Guide to Aviation Electronics, Avionics Vol 1, Air Space Co. |
| [EPO] | European Patent Specification, 1997, A Position Indicating System, European Patent Office - EPO |
| [GP&C/S 1] | GP&C Sweden AB, Lennart Dreier, 1997, Transceiver Specification, 10W for GP&C Transponder R3, GP&C Sweden AB. |
| [IMO Nav 43] | International Maritime Organization, 1997, Draft Recommendation on Performance Standards for a Universal Shipborne Automatic Identification System. IMO. |
| [ICAO AMCP] | VDL Mode 4 SARPS. |
| [MCC] | Meteor Communications Corporation, 1997, Technical Characteristics of a Shipborne Automatic Identification System using CS/TDMA Techniques in the VHF Mobile Band, Meteor Communications Corporation. |
| [IALA] | International Association of Light House Authorities, 1997, Technical Characteristics for a Shipborne Automatic Identification System using TDMA in the VHF Maritime Mobile Band, IALA.. |
| [Holme et al] | I. M. Holme, B. K. Solvang, 1991, Forskningsmetodik - Om kavalitativa och kvantitativa metoder, Studentlitteratur |
| [Frisk et al] | Gunnar Frisk, Fredrik Claesson, Nick McFarlane, 1998, Simulation of ADS-B using VDL Mode 4 in the LA Basin Scenario and a European Scenario, Swedish CAA. |
| [PMEI] | Project Management Enterprises Inc, 1995, Strawman Loading Scenario for STDMA-based Services in the LA Basin, PMEI. |
| [GP&C/S 2] | GP&C Sweden AB, Lennart Dreier, 1997, Requirement Specification for Transponder R3, GP&C Sweden AB. |
| [S Heppe et al] | Stephen Heppe, Woody Phlong, Frederick Seelig, 1994, Evaluation of Swedish GP&C System for ASTA Data Link, US DOT/Volpe Center. |